Greenhouse Gas management
Topic
PARAMETER IV – GREENHOUSE GAS MANAGEMENT ACTIVITIES
Greenhouse Gas Management Activities-Parameter IV takes into account carbon offset project activity, level of policy support for carbon emissions reduction, and local corporate awareness of carbon issues through a total of 13 indicator inputs. Parameter IV contributed 15% toward each nation’s overall score.
Relevant indicators are arranged into three categories: Carbon Offsets, Carbon Policy and Corporate Awareness. The Carbon Offset category measures what countries have done to develop offset projects and their potential to continue into the future. It holds the greatest weight toward the overall Parameter IV score at 40%. The other two categories account for 30% apiece.
It is worth noting that Climatescope methodology does not measure countries’ emissions or reduce their scores when these are high. Rather, it seeks to take into account efforts launched explicitly to reduce future emissions.
KEY FINDINGS
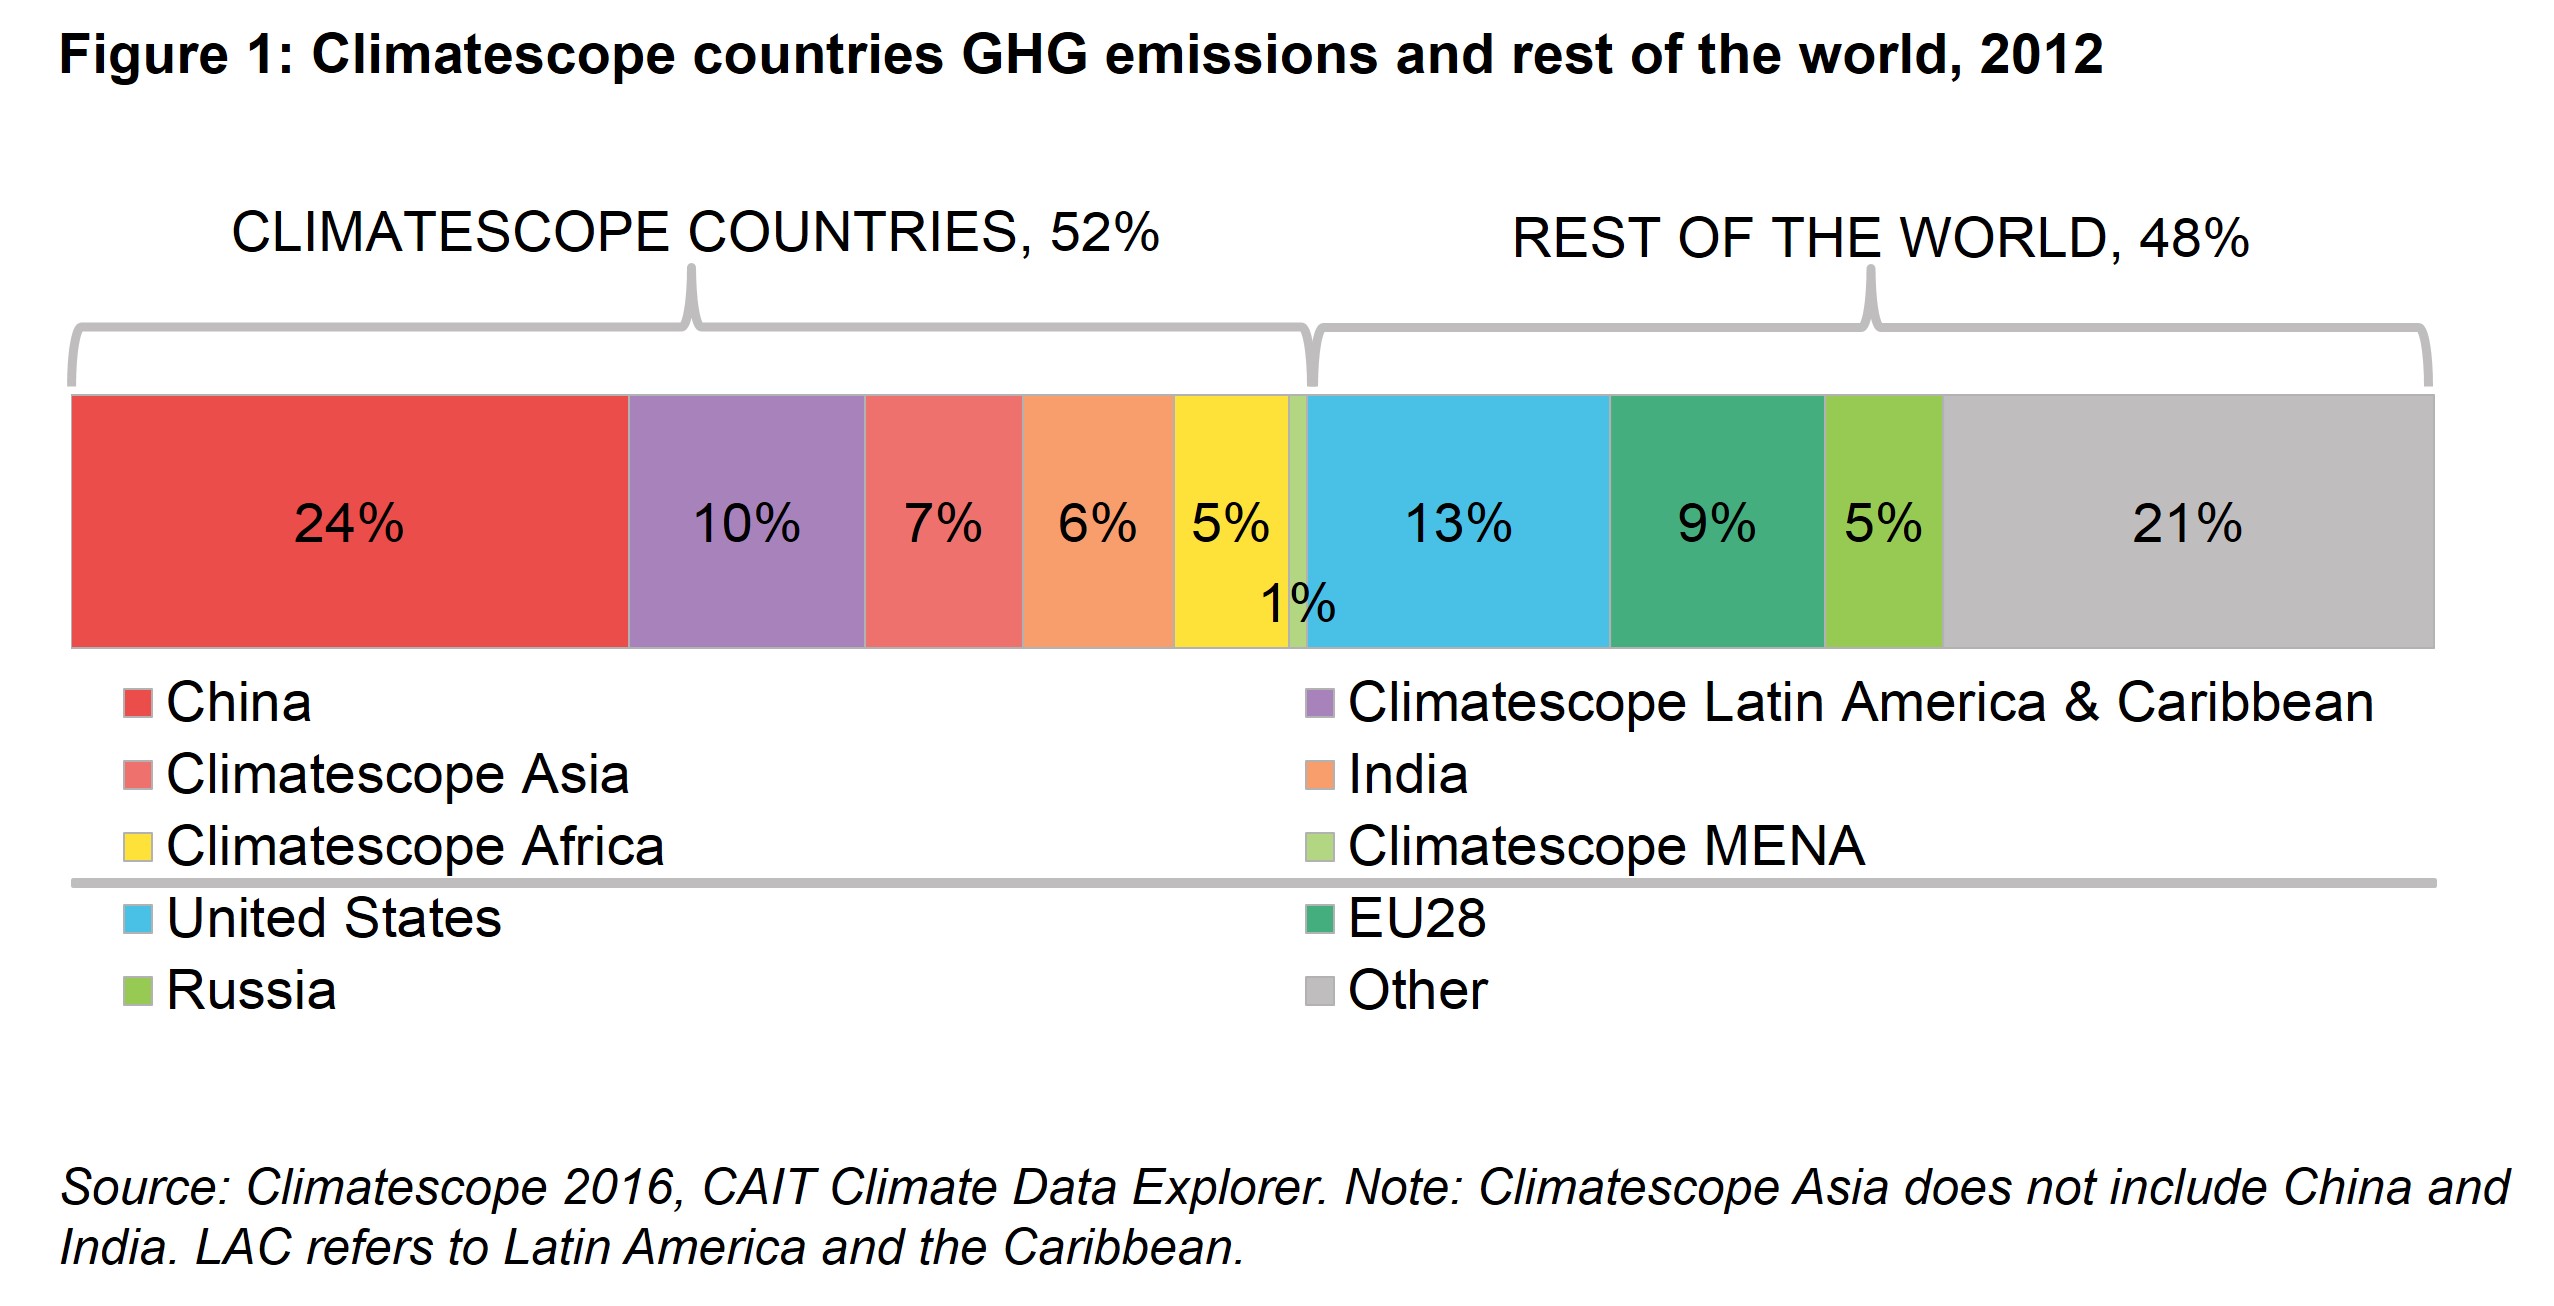
Across all 58 Climatescope nations, the average Parameter IV score ticked up to 1.56 from 1.36 in 2015 and 1.34 in 2014. This increase is generally explained by the fact that the majority of countries submitted greenhouse gas (GHG) emission reduction targets as Intended National Determined Contributions (INDC) in advance of the COP21 meeting in Paris in December 2015. Assuming countries follow through on promises to improve their mitigation efforts and carbon policies, further score improvements may be expected in coming years. The critical importance of climate change mitigation policies in Climatescope countries is highlighted by the fact that these nations accounted for just over half of total GHG emissions worldwide and China alone for just under a quarter in 2012, the latest year for which complete data exists (Figure 1).
More importantly, Climatescope countries are where emissions are projected to grow most as they encompass some of the most dynamic economies in the world. India for example is expected to more than double its GHG emissions by 2030 under current policy projections. Hence, the implementation of emission reduction policies and the development of carbon offset projects by local governments, the public and private sector, and with the support of the international community must, be a cornerstone of global climate change mitigation efforts.
INTENDED NATIONAL DETERMINED CONTRIBUTIONS (INDC)
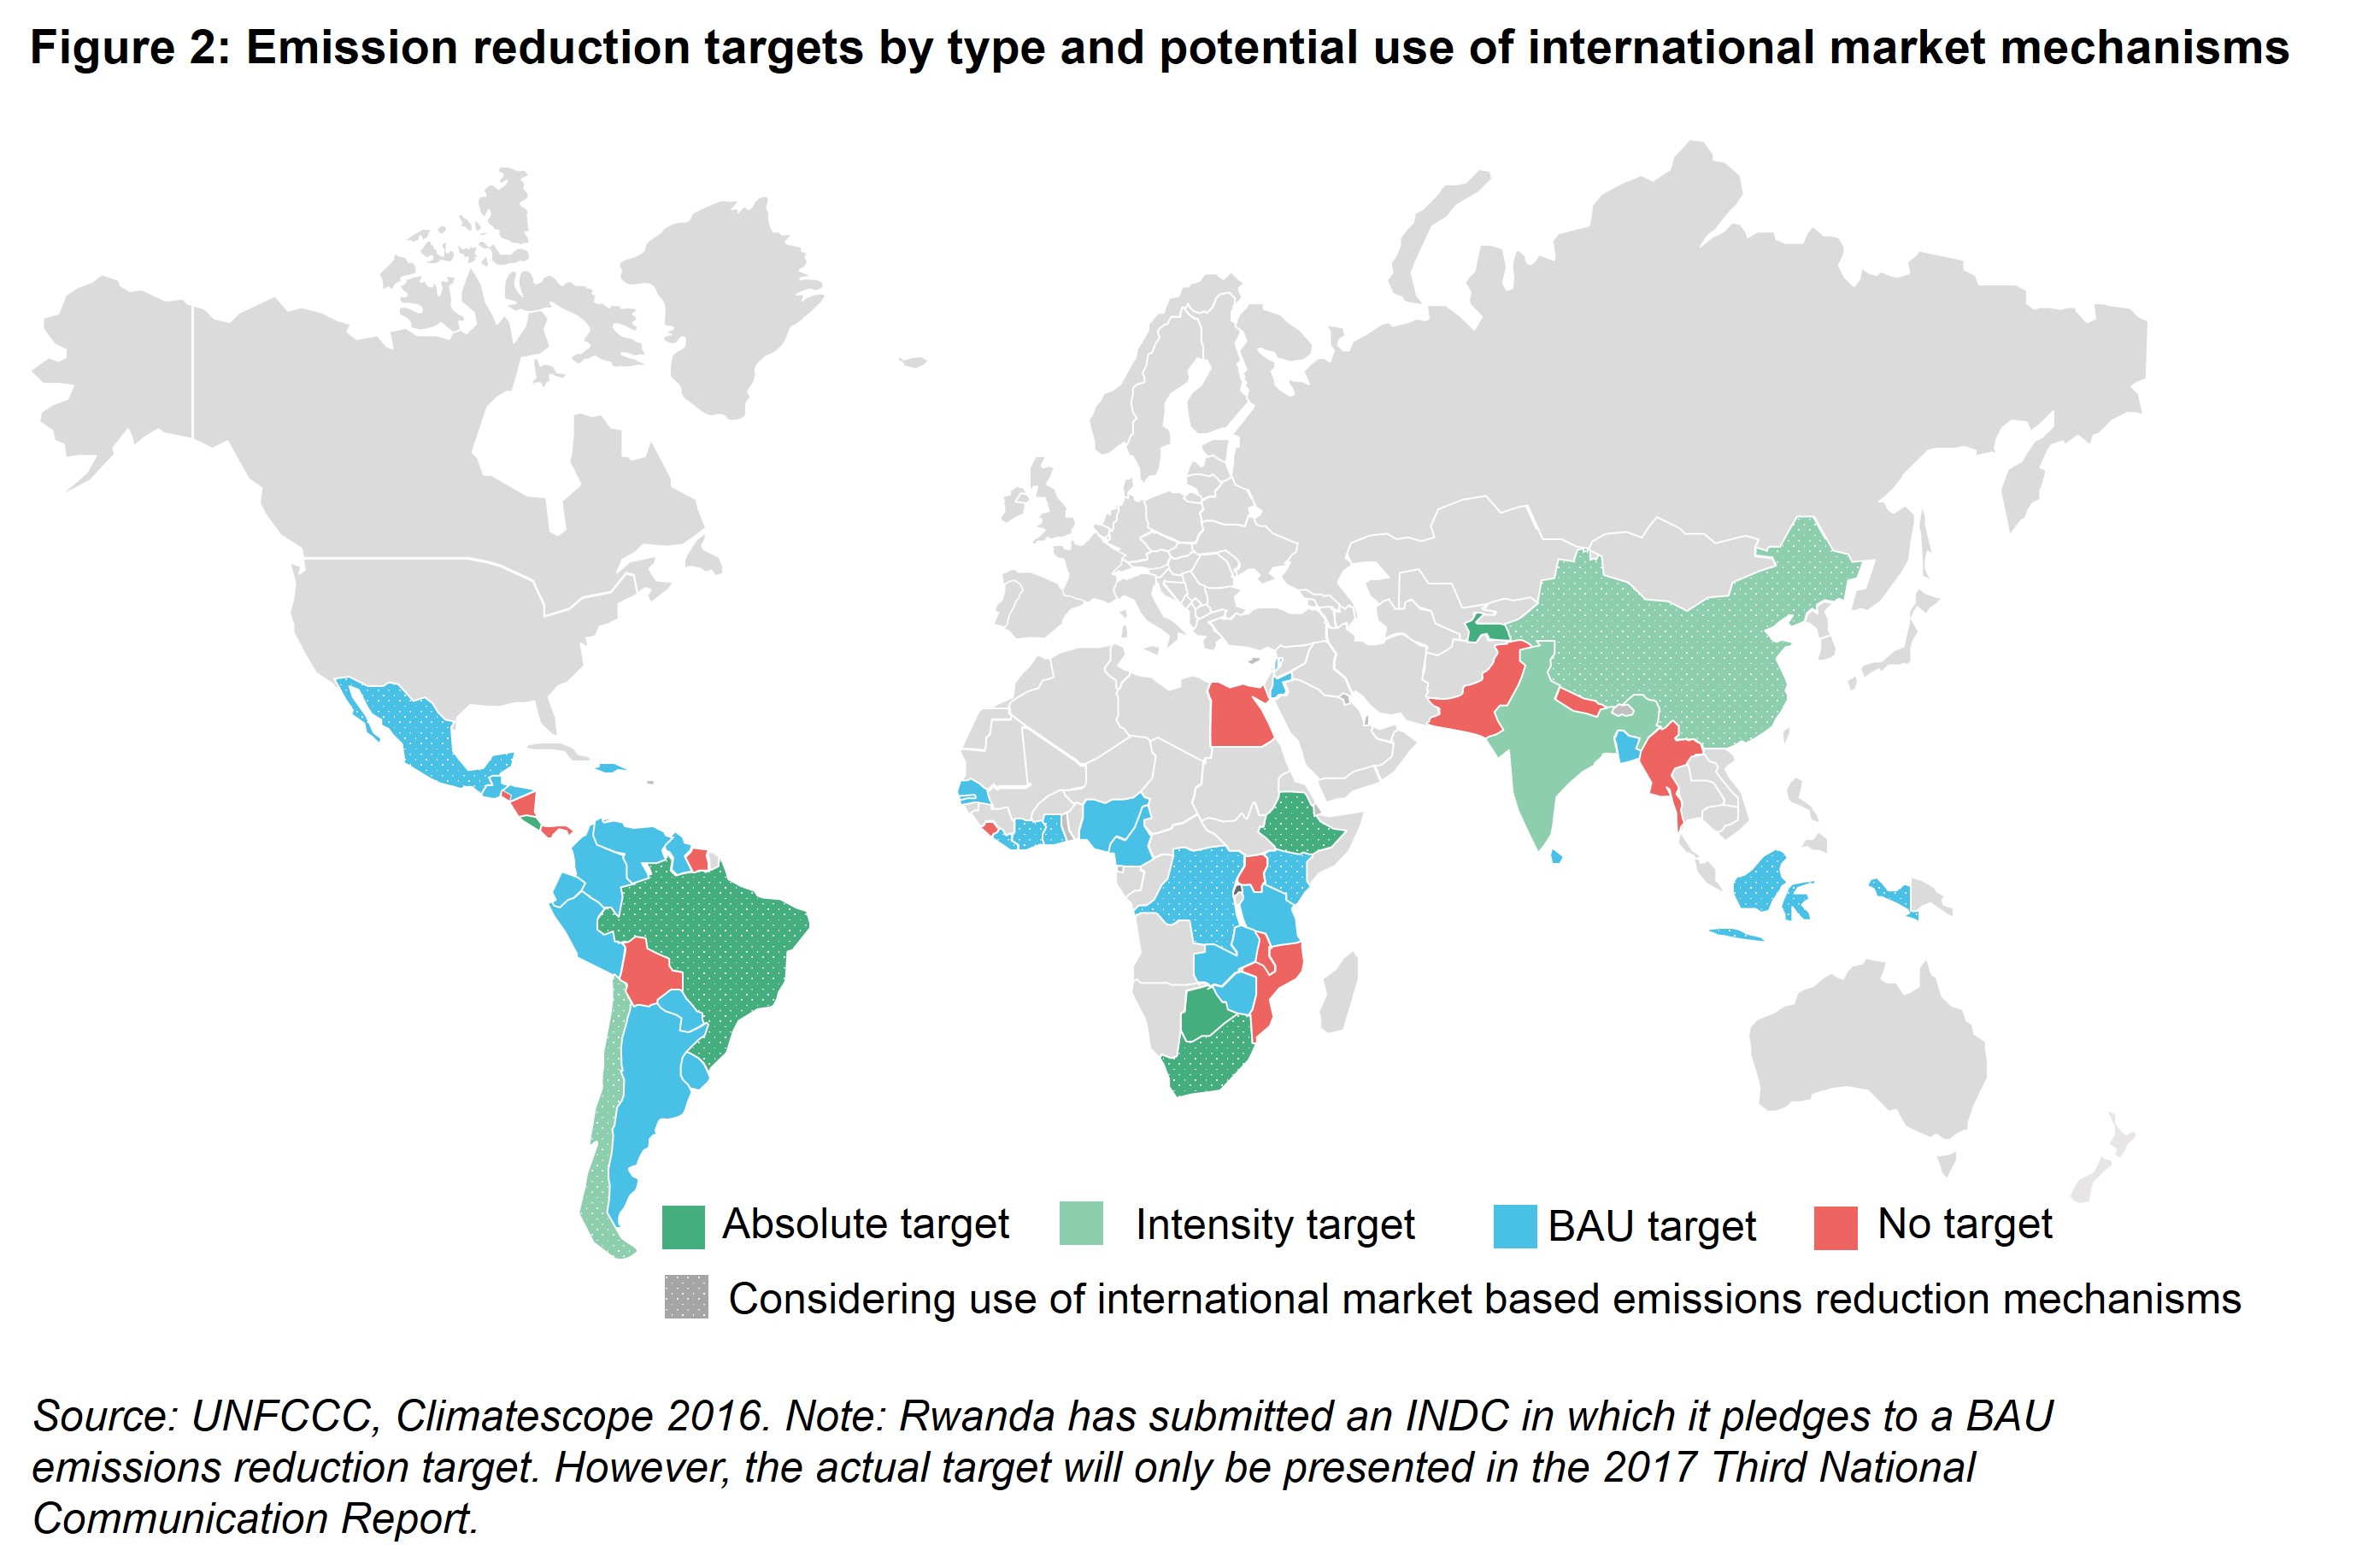
In 2015, countries submitted their INDCs to the United Nations to communicate steps they plan to take to address climate change. INDCs include emission reduction targets which can be conditional upon support of the international community, unconditional, or a combination of both. Participation among the 58 Climatescope countries was broad, with 43 nations submitting their INDCs with emission reduction targets (Figure 2). The targets are include three types of commitments:
- Absolute targets relative to total actual emissions in a base year and therefore a commitment to an absolute reduction. Six Climatescope countries submitted absolute targets. Brazil, for example, has committed to reduce its GHG emissions by 37% from 2005 levels by 2025.
- Intensity targets relative to GHG emissions per unit of GDP. Four Climatescope countries submitted intensity targets. China, for example, has committed to reduce the level of GHG emissions per unit of GDP by 60-65% from 2005 levels by 2030. This would allow for a tripling of emissions from 2005 levels over the period if the economy grows by 5% a year.
- Business as usual targets (BAU) relative to a future BAU scenario, which takes into consideration future economic and population growth. A total of 33 Climatescope countries submitted BAU targets. Côte d’Ivoire, for example, has committed to reduce GHG emissions by 28% below its BAU trajectory by 2030. This would allow for around a 150% increase in emissions from current levels.
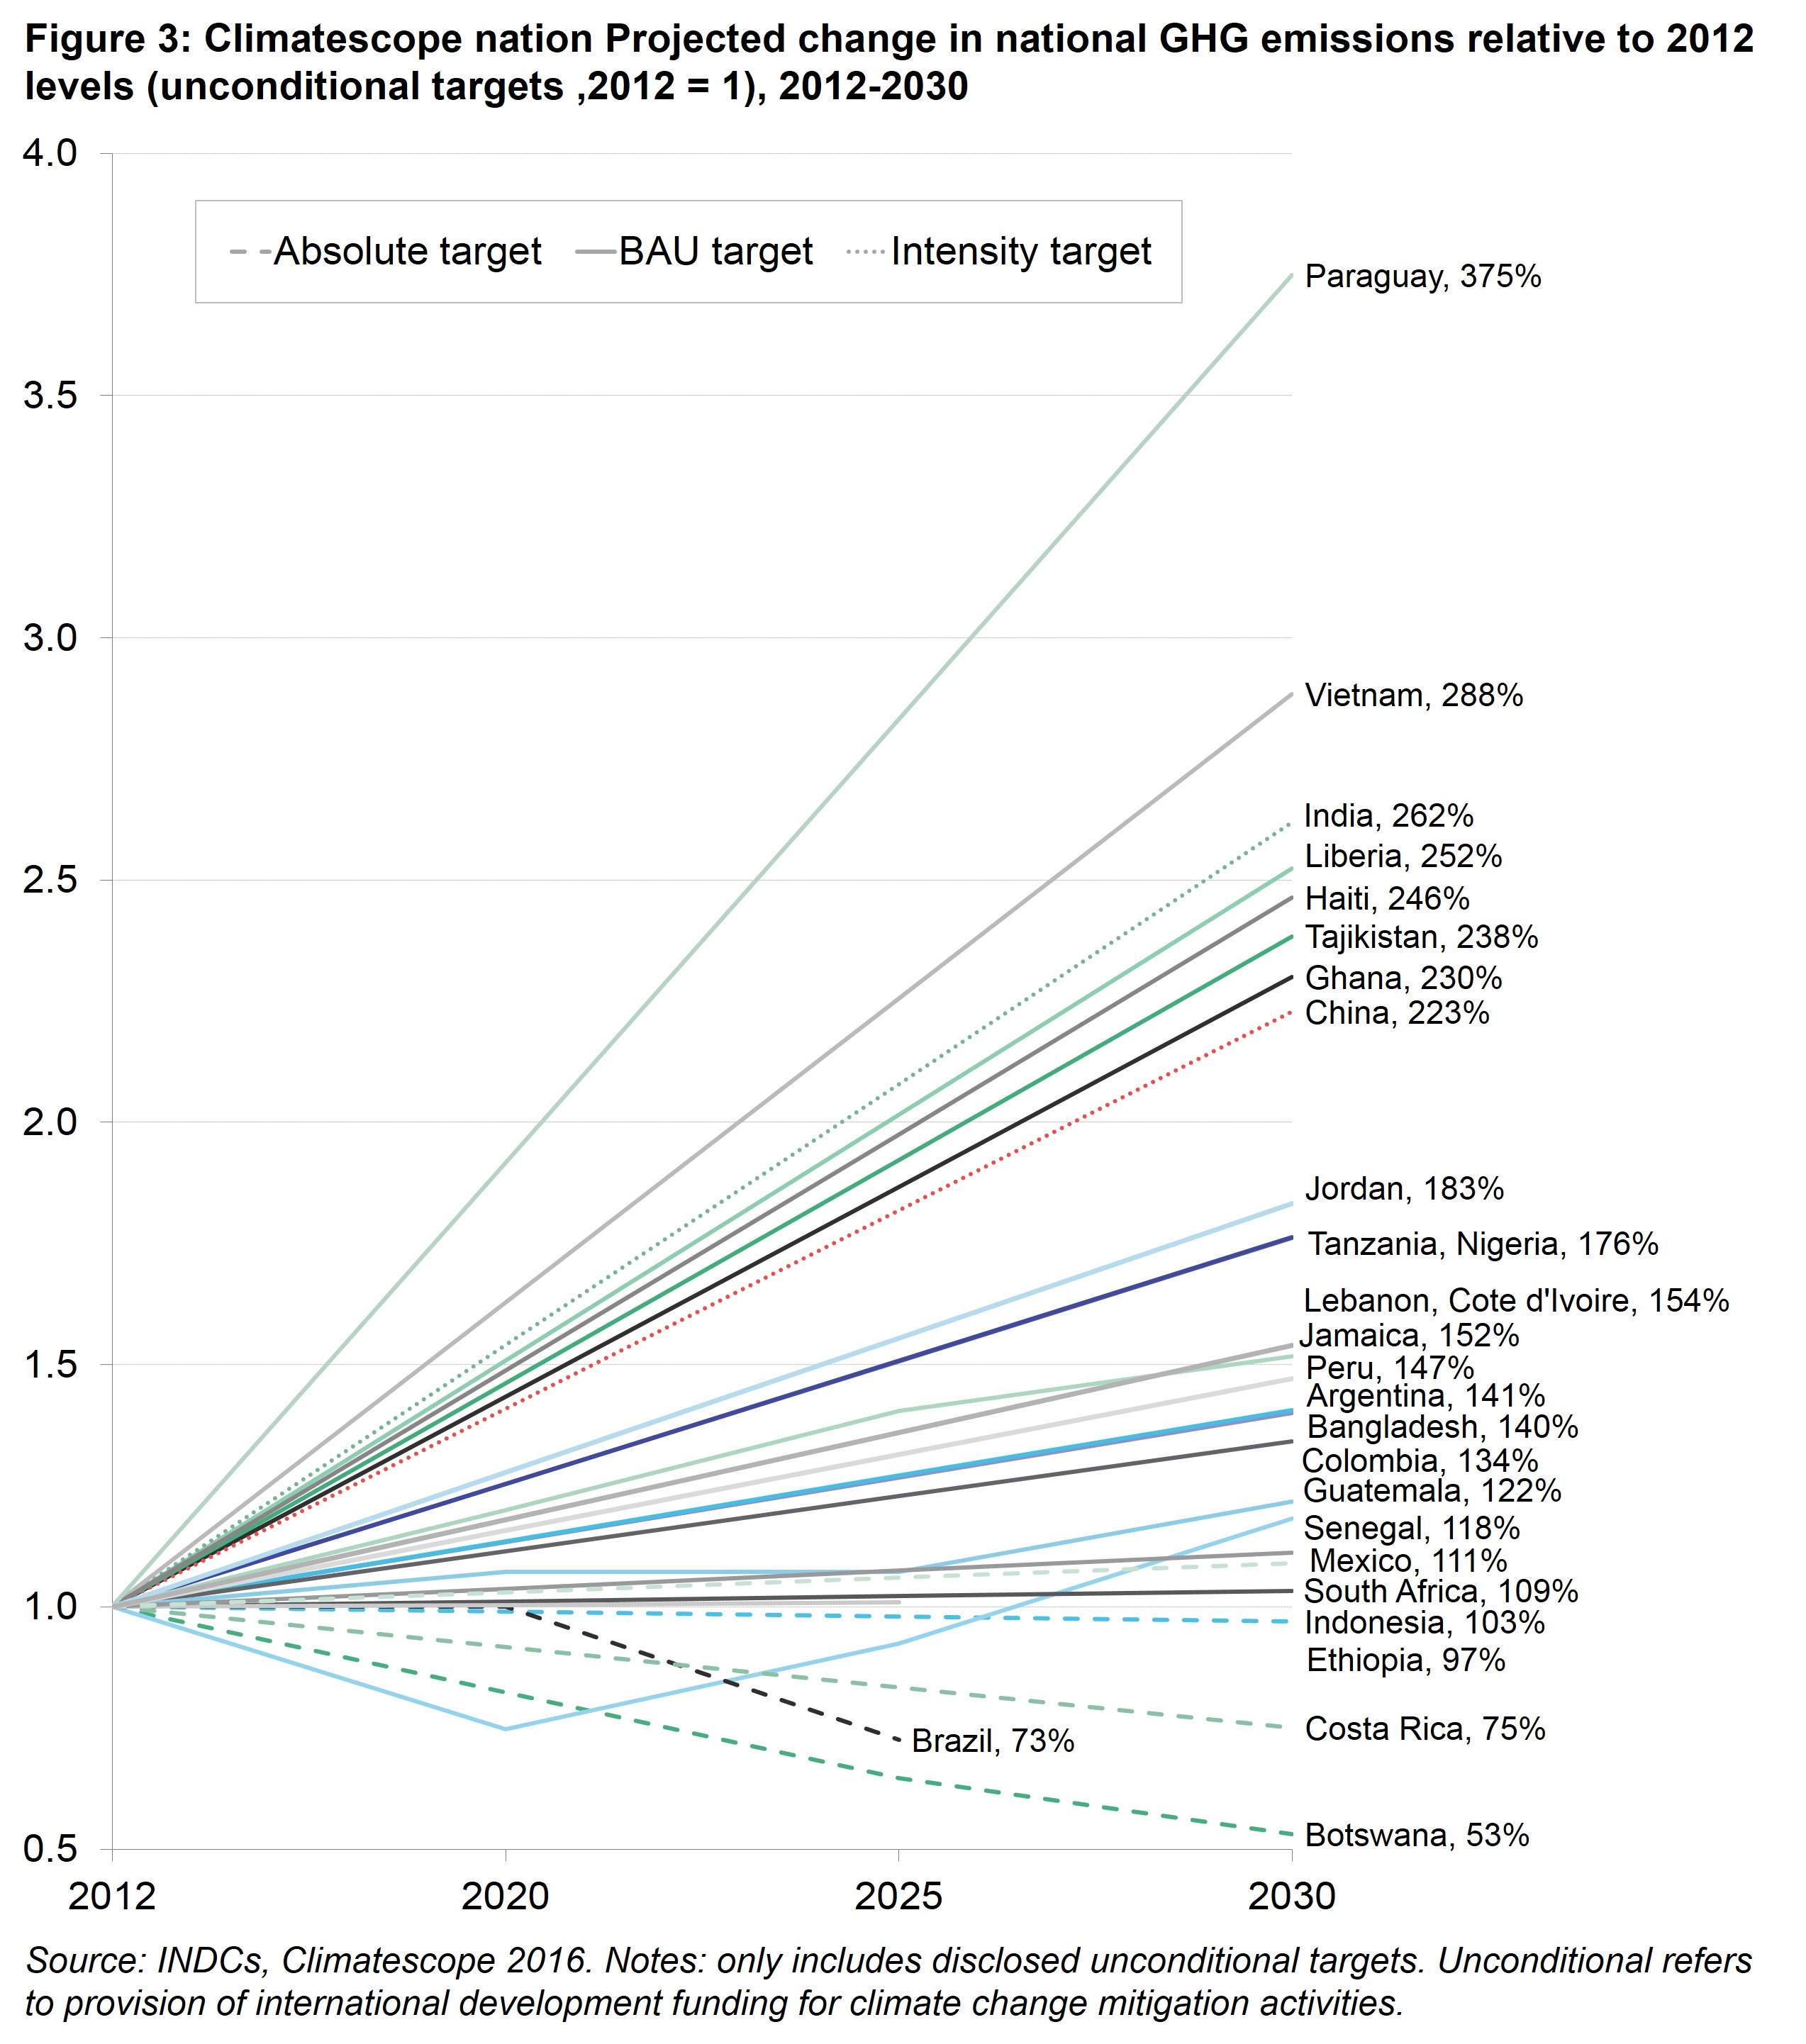
Brazil, China and South Africa are some of the Climatescope countries that have stated they would consider participating in global market based mechanisms to reduce emissions (Figure 3). Currently, the European Union (EU) is the only regional organization in which carbon certificates are traded across countries, but its implementation has come with a number of challenges. The EU has already started collaborating with Australia, California and China on merging their emissions trading markets, however there is no indication that these initiatives will have tangible results in the near future. Nonetheless, it is welcome news that some of the largest countries in Climatescope have expressed their interest to enter such a global market in the future.
Botswana, Brazil, Costa Rica and Ethiopia are the only Climatescope countries that have committed to emit less in the future than they did in 2012. This is explained by the fact that most emerging markets are banking on high emission increases in line with high economic growth projections. China and India are forecasting emissions growth but are committed to reduce the carbon intensity of their economies by 65% and 35%, respectively, by 2030. We estimate that this will represent a 123% increase in China’s emissions (or an addition of 13,120MtCO2e) and a 162% increase in India’s emissions (4,675MtCO2e) in 2030 compared to 2012. South Africa has set itself the goal of having emissions in the range of 398-614MtCO2e for the period 2025 to 2030.
THE POTENTIAL IMPACT OF INTERNATIONAL SUPPORT
In addition to unconditional goals, 27 Climatescope countries submitted further emission reduction targets specifically contingent on receiving international support. A key next step in the current international climate negotiations will involve developed countries providing support to developing countries for the purpose of implementing more ambitious mitigation actions. We calculate that with appropriate support, these countries together can cut their emissions by an additional 1,205MtCO2e compared to their unconditional targets (Figure 4). This is equivalent to around 2.6% of the world’s total emissions as of 2012.
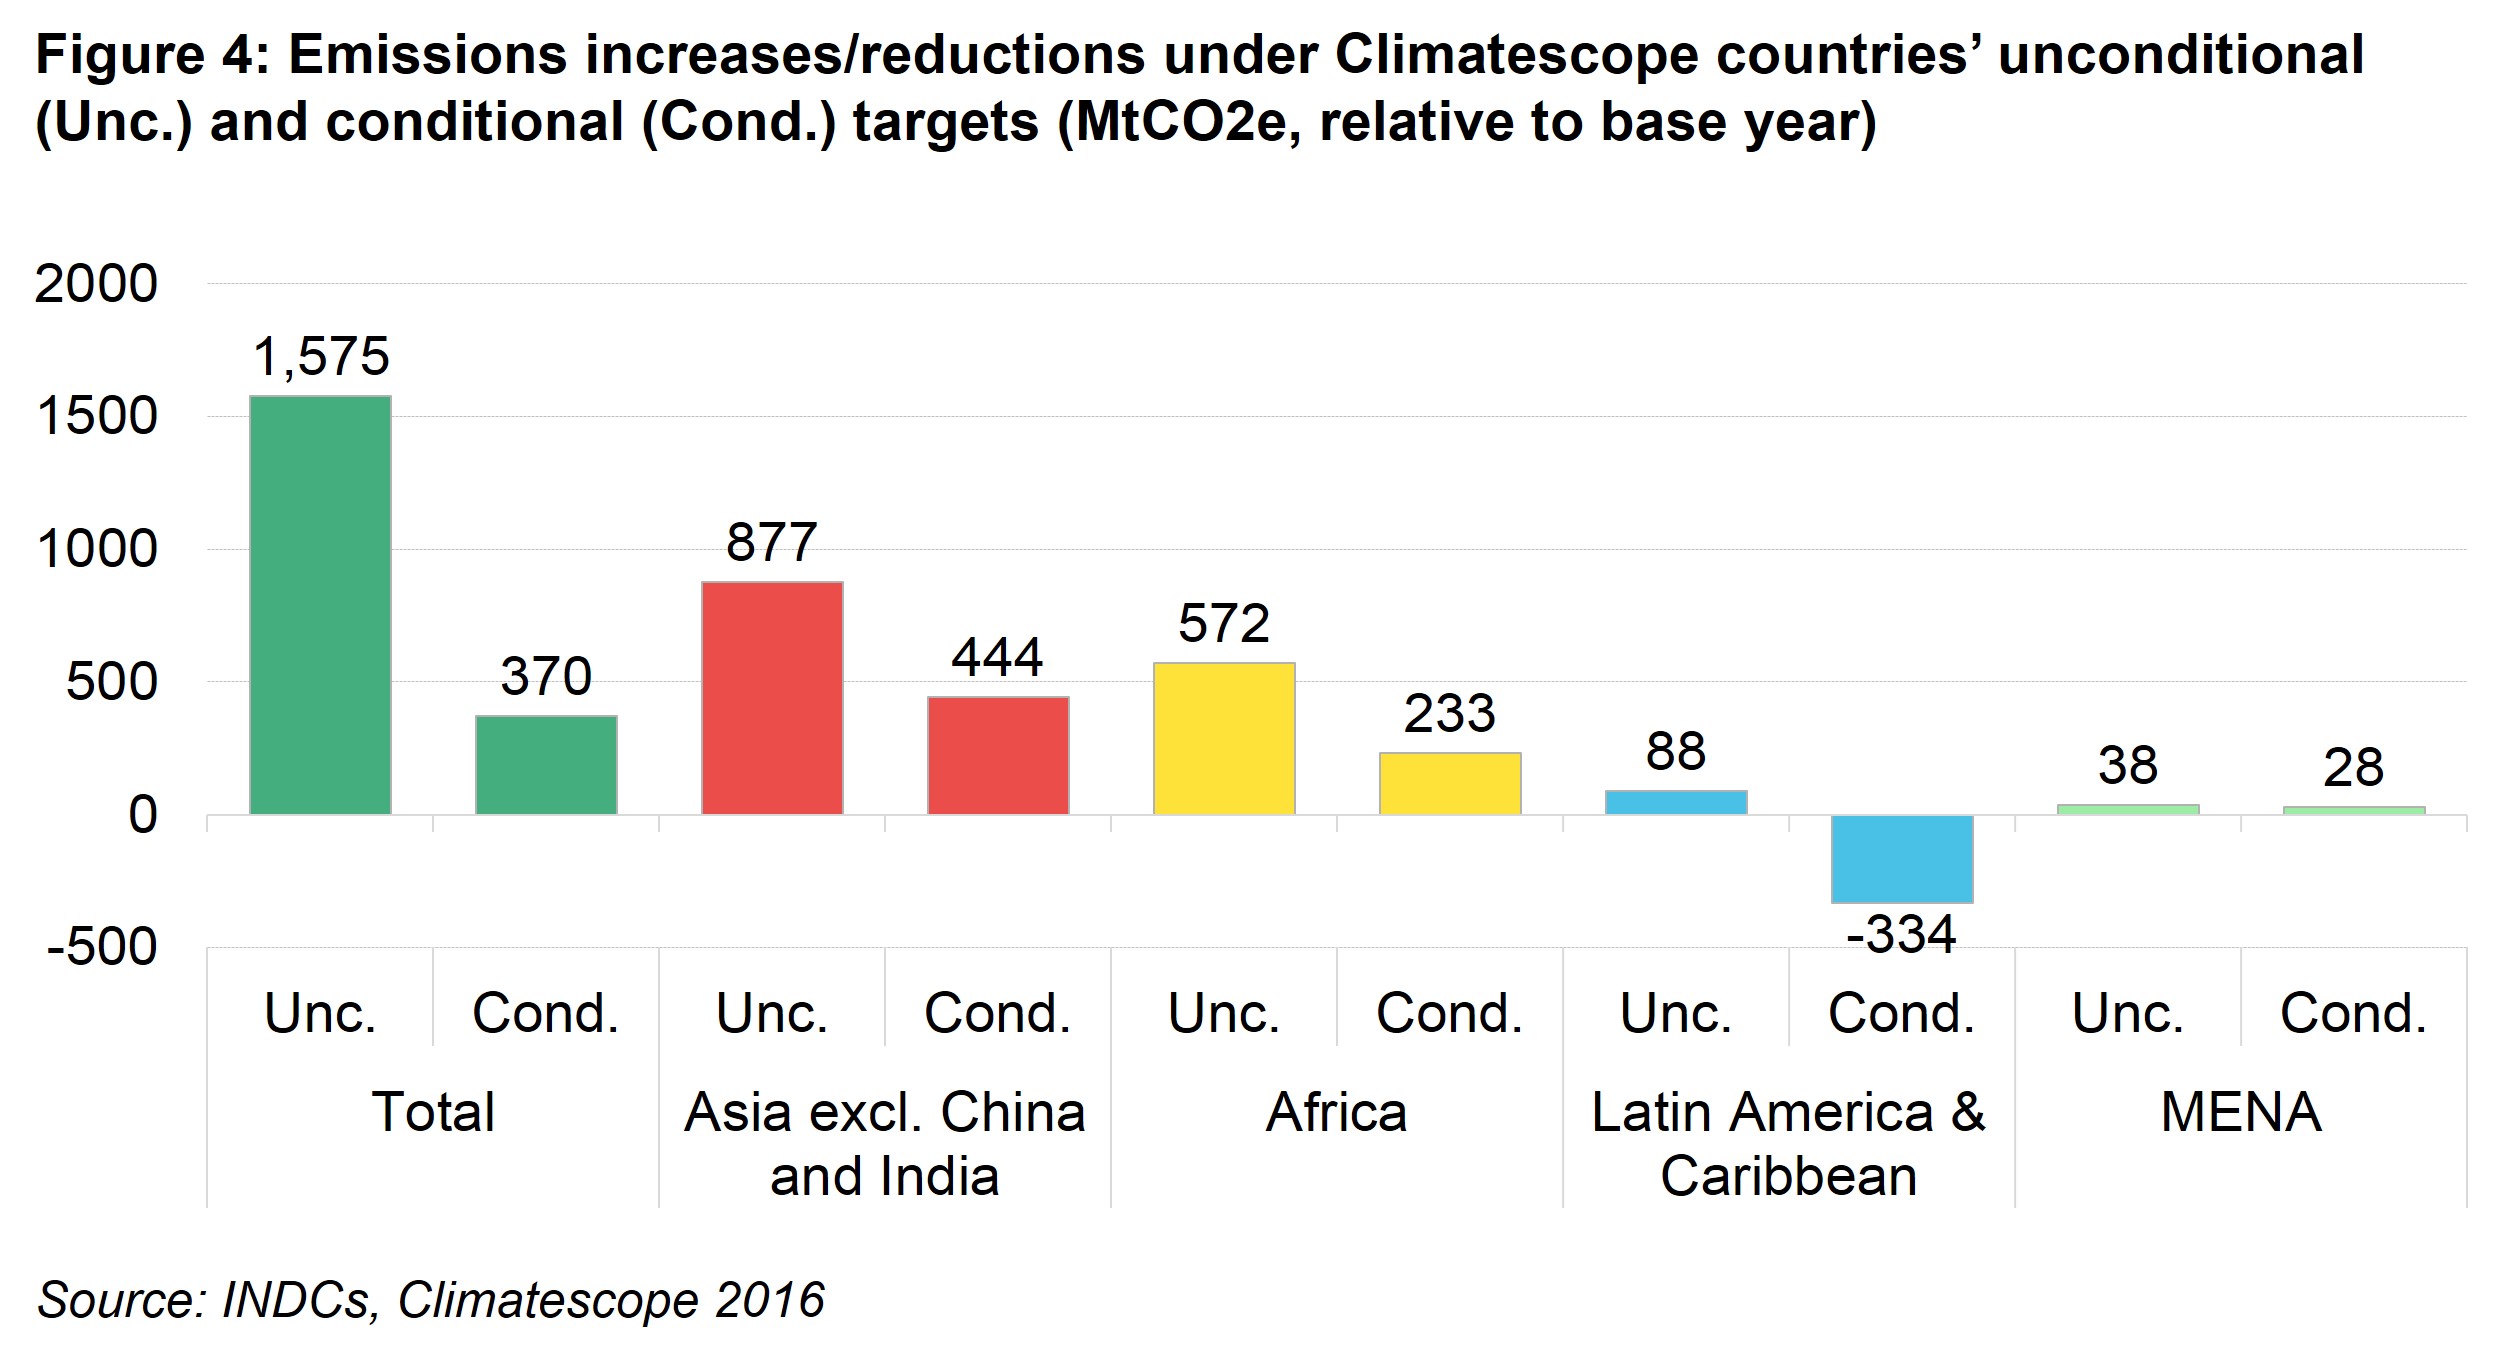
The five Asia Climatescope countries which have made emissions reduction pledges (excluding India and China) are also expected to have the most significant rise in emissions over the next 15 years. Collectively, they have committed to cut this increase in half – if financial and technical support is provided. Indonesia accounts for the majority of these emissions. The country has committed to limit its increase to 245MtCO2e by 2030 against 2005 levels unconditionally and to a reduction of 100MtCO2e by 2030 if international support is provided.
The size of Climatescope sub-Saharan Africa’s carbon footprint is comparatively small. The 19 countries in the survey account for just 9% of the total emissions from the 58 Climatescope countries overall. Still, African countries in Climatescope are expecting to grow their emissions by 25%, or a combined 572MtCO2e, under their unconditional pledges. Compared with other regions, countries in sub-Saharan Africa are clearer on the level of support they will need to commit to more aggressive emissions curbs. They estimate around $178bn 1 of financial and technical help will allow them to make additional cuts of 339MtCO2e beyond their unconditional commitments.
Latin America and the Caribbean is the only region expected to have absolute emissions reductions in a conditional scenario. This will be mostly led by Brazil, which has one of the largest absolute emissions reduction targets in the world. The country is committed to cut 777MtCO2e unconditionally and 903MtCO2e conditionally by 2025 compared to 2012 levels.
Among Climatescope’s three Middle East and North African nations, Jordan and Lebanon have set BAU targets and aim to reduce emissions conditionally by 13% and 30% compared to a BAU scenario, respectively. Jordan has set one of the most conservative unconditional targets among Climatescope nations, which would allow it to grow them from 29MtCO2e in 2006 to 50MtCO2e in 2030. The country aims to reduce emissions by only 2% compared to a BAU scenario. The goal allows emissions to double between 2006 and 2030.
CURRENT COMMITMENT AND FUTURE POTENTIAL
Climatescope Parameter IV scores highlight strong relationships between a country’s potential to cut emissions, the GHG management activities already seen in-country (typically through offset projects or other actions) and its current policy structures.
Most carbon reduction activities in Climatescope countries could be more ambitious – with some notable exceptions. South Africa, Chile, China and Brazil have the top four Parameter IV scores and the largest potential to cut emissions. These countries have set non-BAU emissions reduction targets, which tend to be more ambitious and therefore require more robust carbon policy frameworks and successful GHG management activities.
Together, these countries have the strongest carbon offset commitments, largest number of offset projects and a high environmental awareness amongst companies. However, all can still make progress on the introduction of carbon reduction policies. Chile is the only one with a carbon tax on electricity generation, introduced in 2014, of around $5/tCO2 in 2015. South Africa and China have a mandatory and voluntary GHG country level registry respectively, and Chile and Brazil are looking to introduce a similar mechanism. All four countries are members of the Partnership for Market Readiness (PMR), a platform designed to provide support to prepare and implement climate change mitigation policies. Uruguay scores a high 2.74 in Parameter IV and is the only country which combines an absolute target with eight intensity targets focusing on specific gases and sectors. The power generation and beef production sectors have been assigned intensity targets of their own as they contribute most to emissions and are critical to Uruguay’s economy. The country is among those with the highest volume of carbon offset projects relative to its size as the government attempts to address issues linked to high methane emissions from livestock.
Charting BAU emissions reduction target ambitions against Parameter IV scores and level of abatement required to meet those targets illuminates which countries have adequate policies in place and which do not (Figure 5).
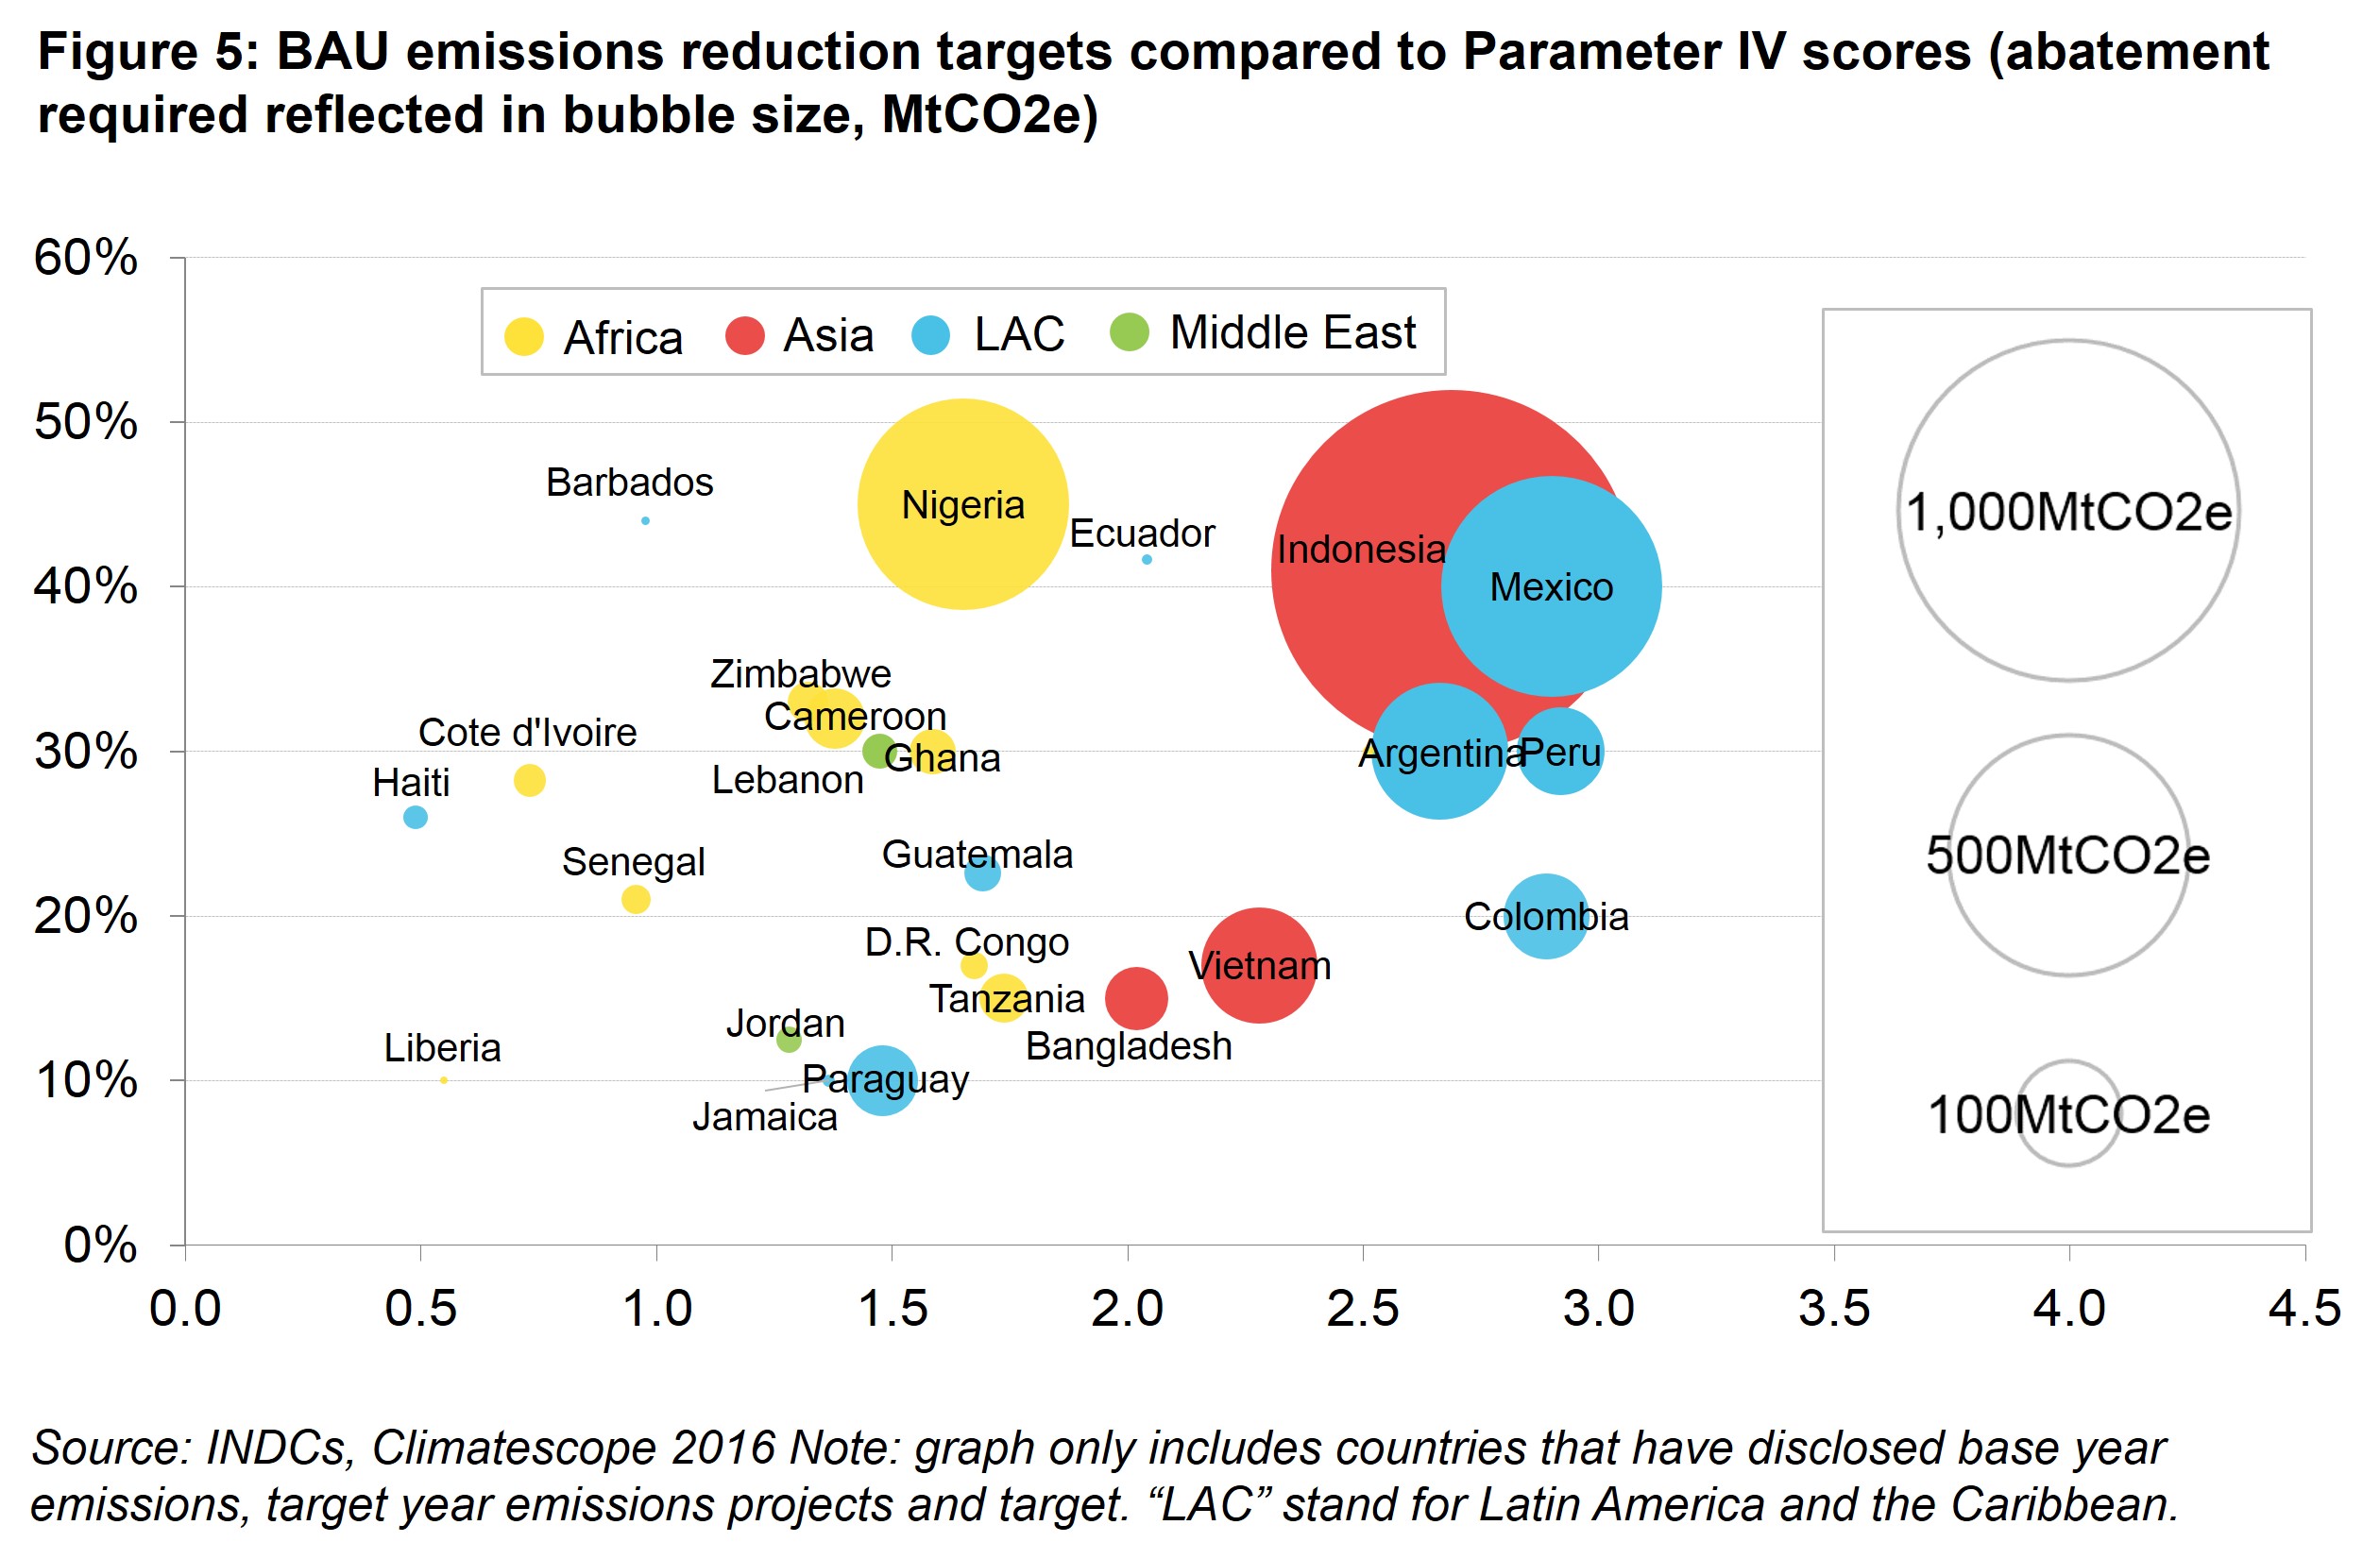
For example, Peru, Mexico, Colombia and Indonesia aim to reduce their emissions 20% compared to a BAU scenario (left axis) and round out the top 10 on Parameter IV in Climatescope 2016 (bottom axis). This implies that these countries are further along a pathway to achieve their targets. The high scores result from an above-average number of offset projects in place and a high level of corporate awareness. All of them count with medium energy efficiency, but lower levels of emissions per capita, which limits their abatement potential.
Nigeria has a relatively ambitious target (left axis) and volume of emissions it has pledged to abate to reach it (bubble size) but it scores below the average for the parameter (bottom axis). This suggests the country has work ahead on emissions reduction.
On the other end, Haiti and Cote d’Ivoire aim to reduce their emission by over 25%, but reached the lowest parameter IV scores. This implies that targets are over-realistic and that governments will need to structure emission reduction policies and carbon offset activities in order to achieve the goals.
1 The number refers to Climatescope countries that have disclosed the financial costs for the implementation of mitigation actions.
Regional average
- %% region.name %%
- %% region.parameters[0].data[0].mean | round:2 %%
| Topic rank | Country | Topic score | Trend | 0.0 - 5.0 Average: %% countryTable.scoreAvg | round:2 %% | Grid |
|---|---|---|---|---|---|
| %% country.data[0].overall_ranking | leadingZero:2 %% | %% country.name %% States | %% country.data[0].value | thousands:2 %% |
|
%% country.grid %% |