Africa and the Middle East
Region
AFRICA & THE MIDDLE-EAST
SUB-SAHARAN AFRICA’S GENERATION CAPACITY GAP
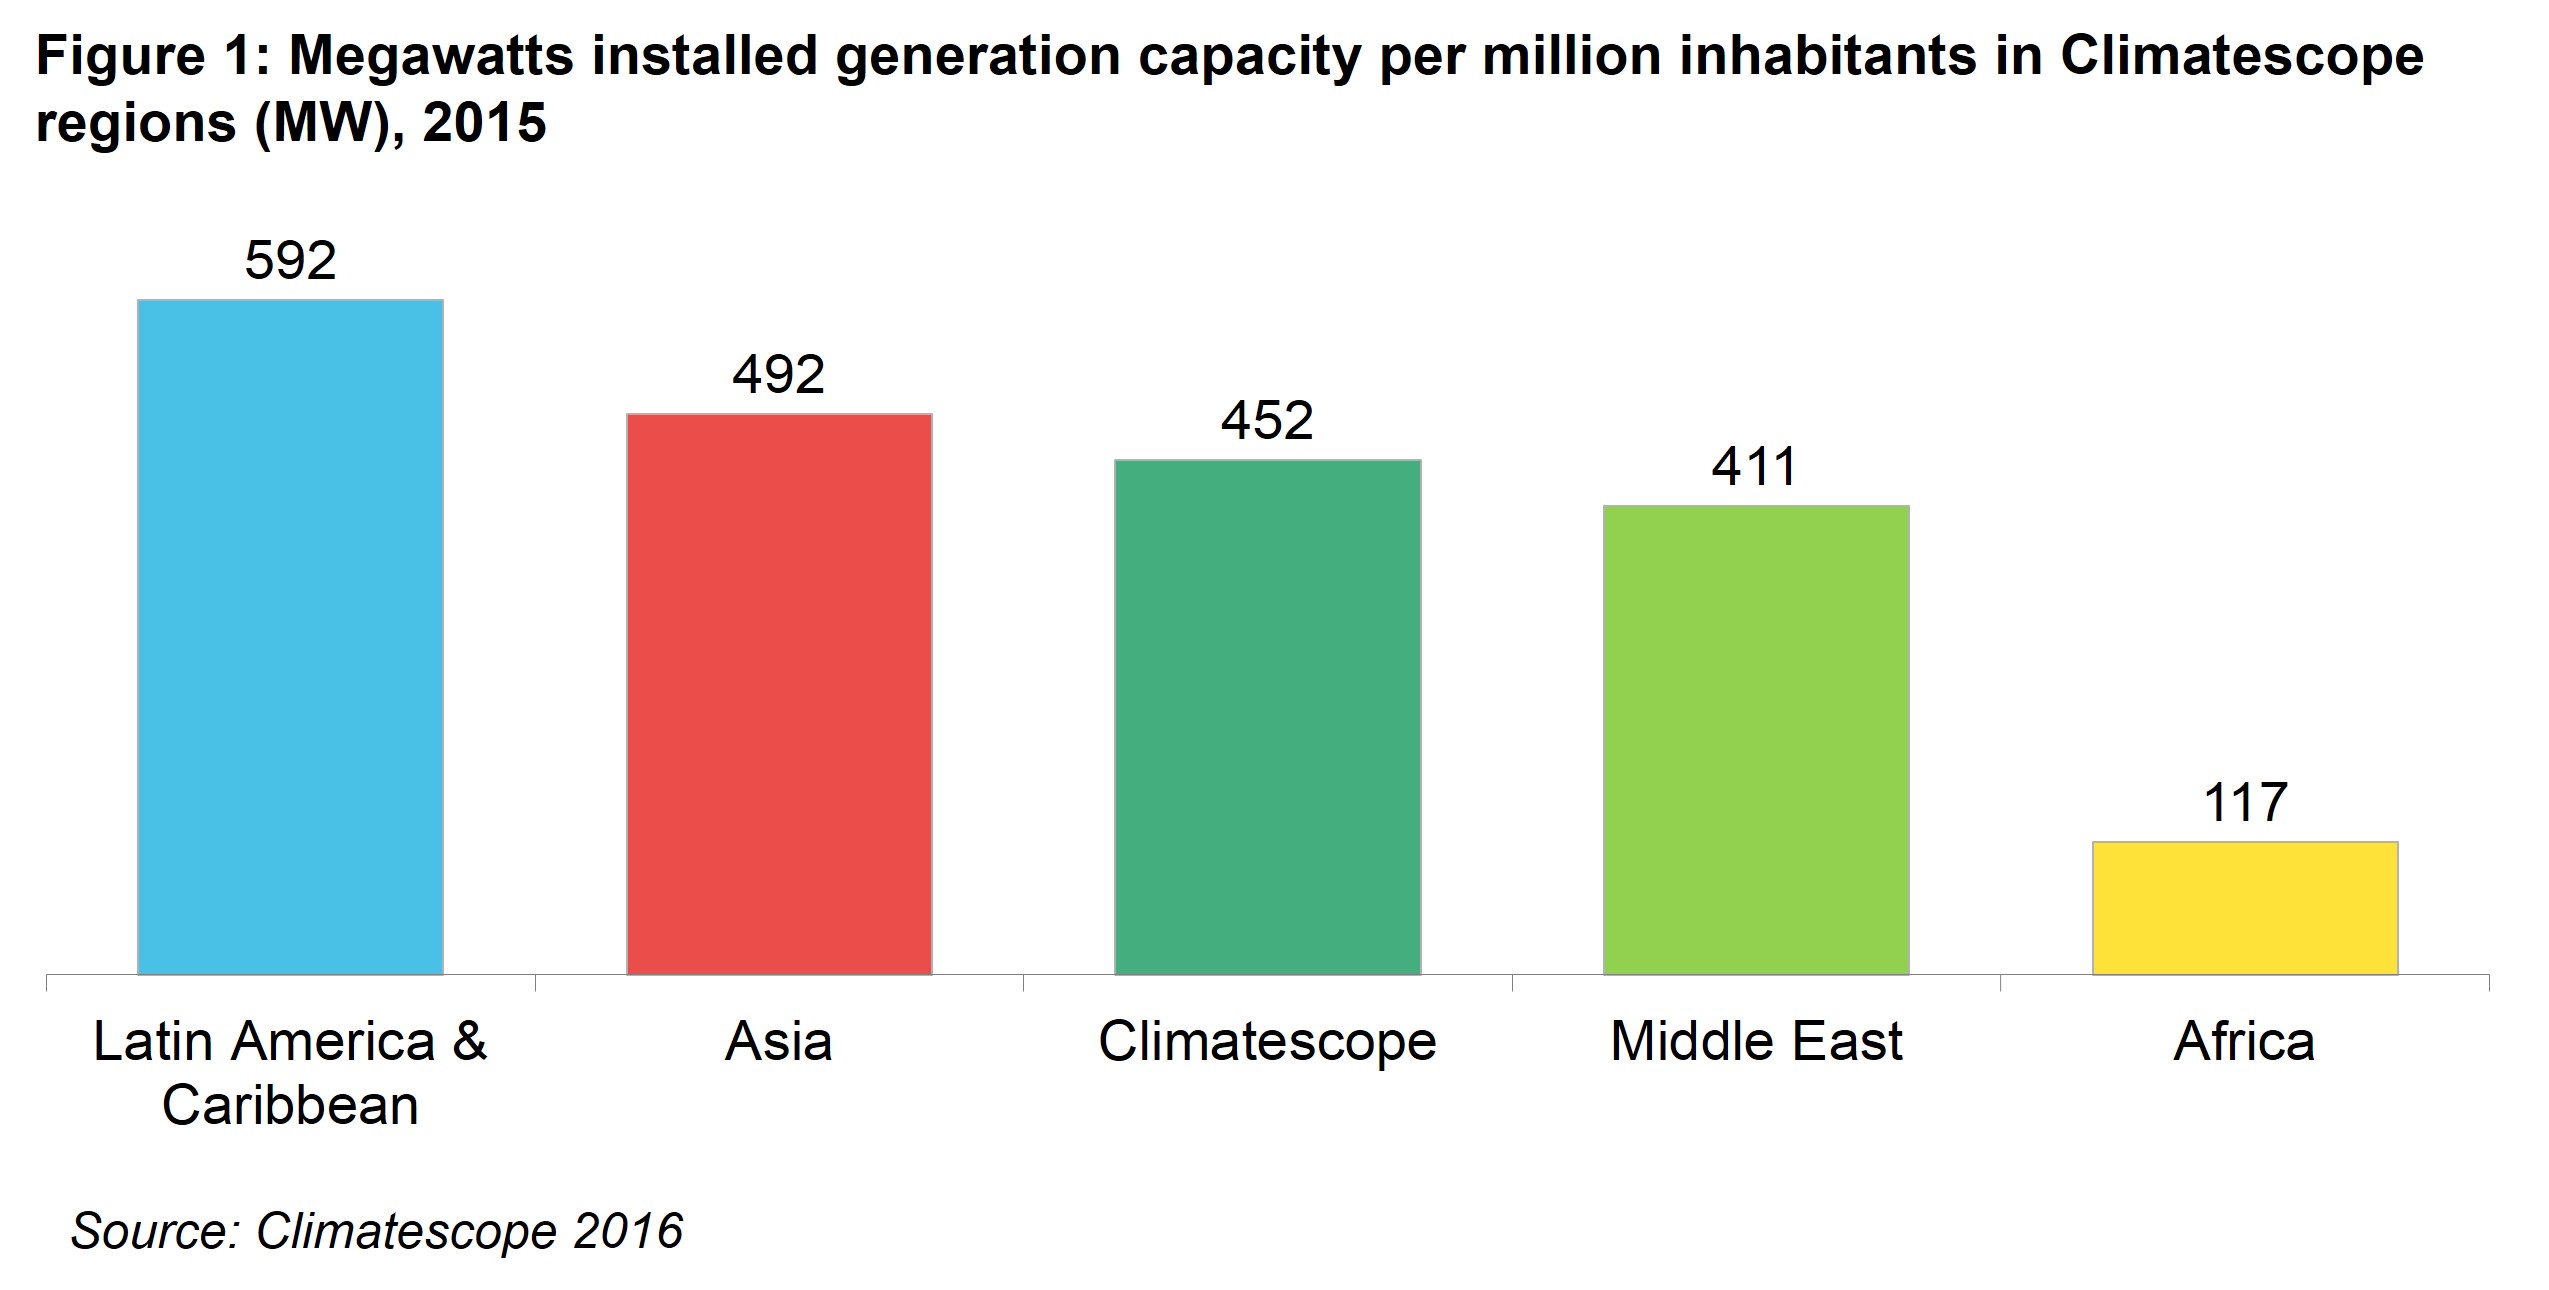
Of the three regions surveyed in Climatescope, sub-Saharan Africa has by far the least installed generation capacity per capita, highlighting severe shortages and massive unmet demand (Figure 1). In all, the 19 Climatescope countries in the region had a total installed capacity of just over 86GW in 2015, 4.6GW of which are renewables. By comparison, the United Kingdom has over 90GW of total capacity installed and the US over 1,000GW installed.
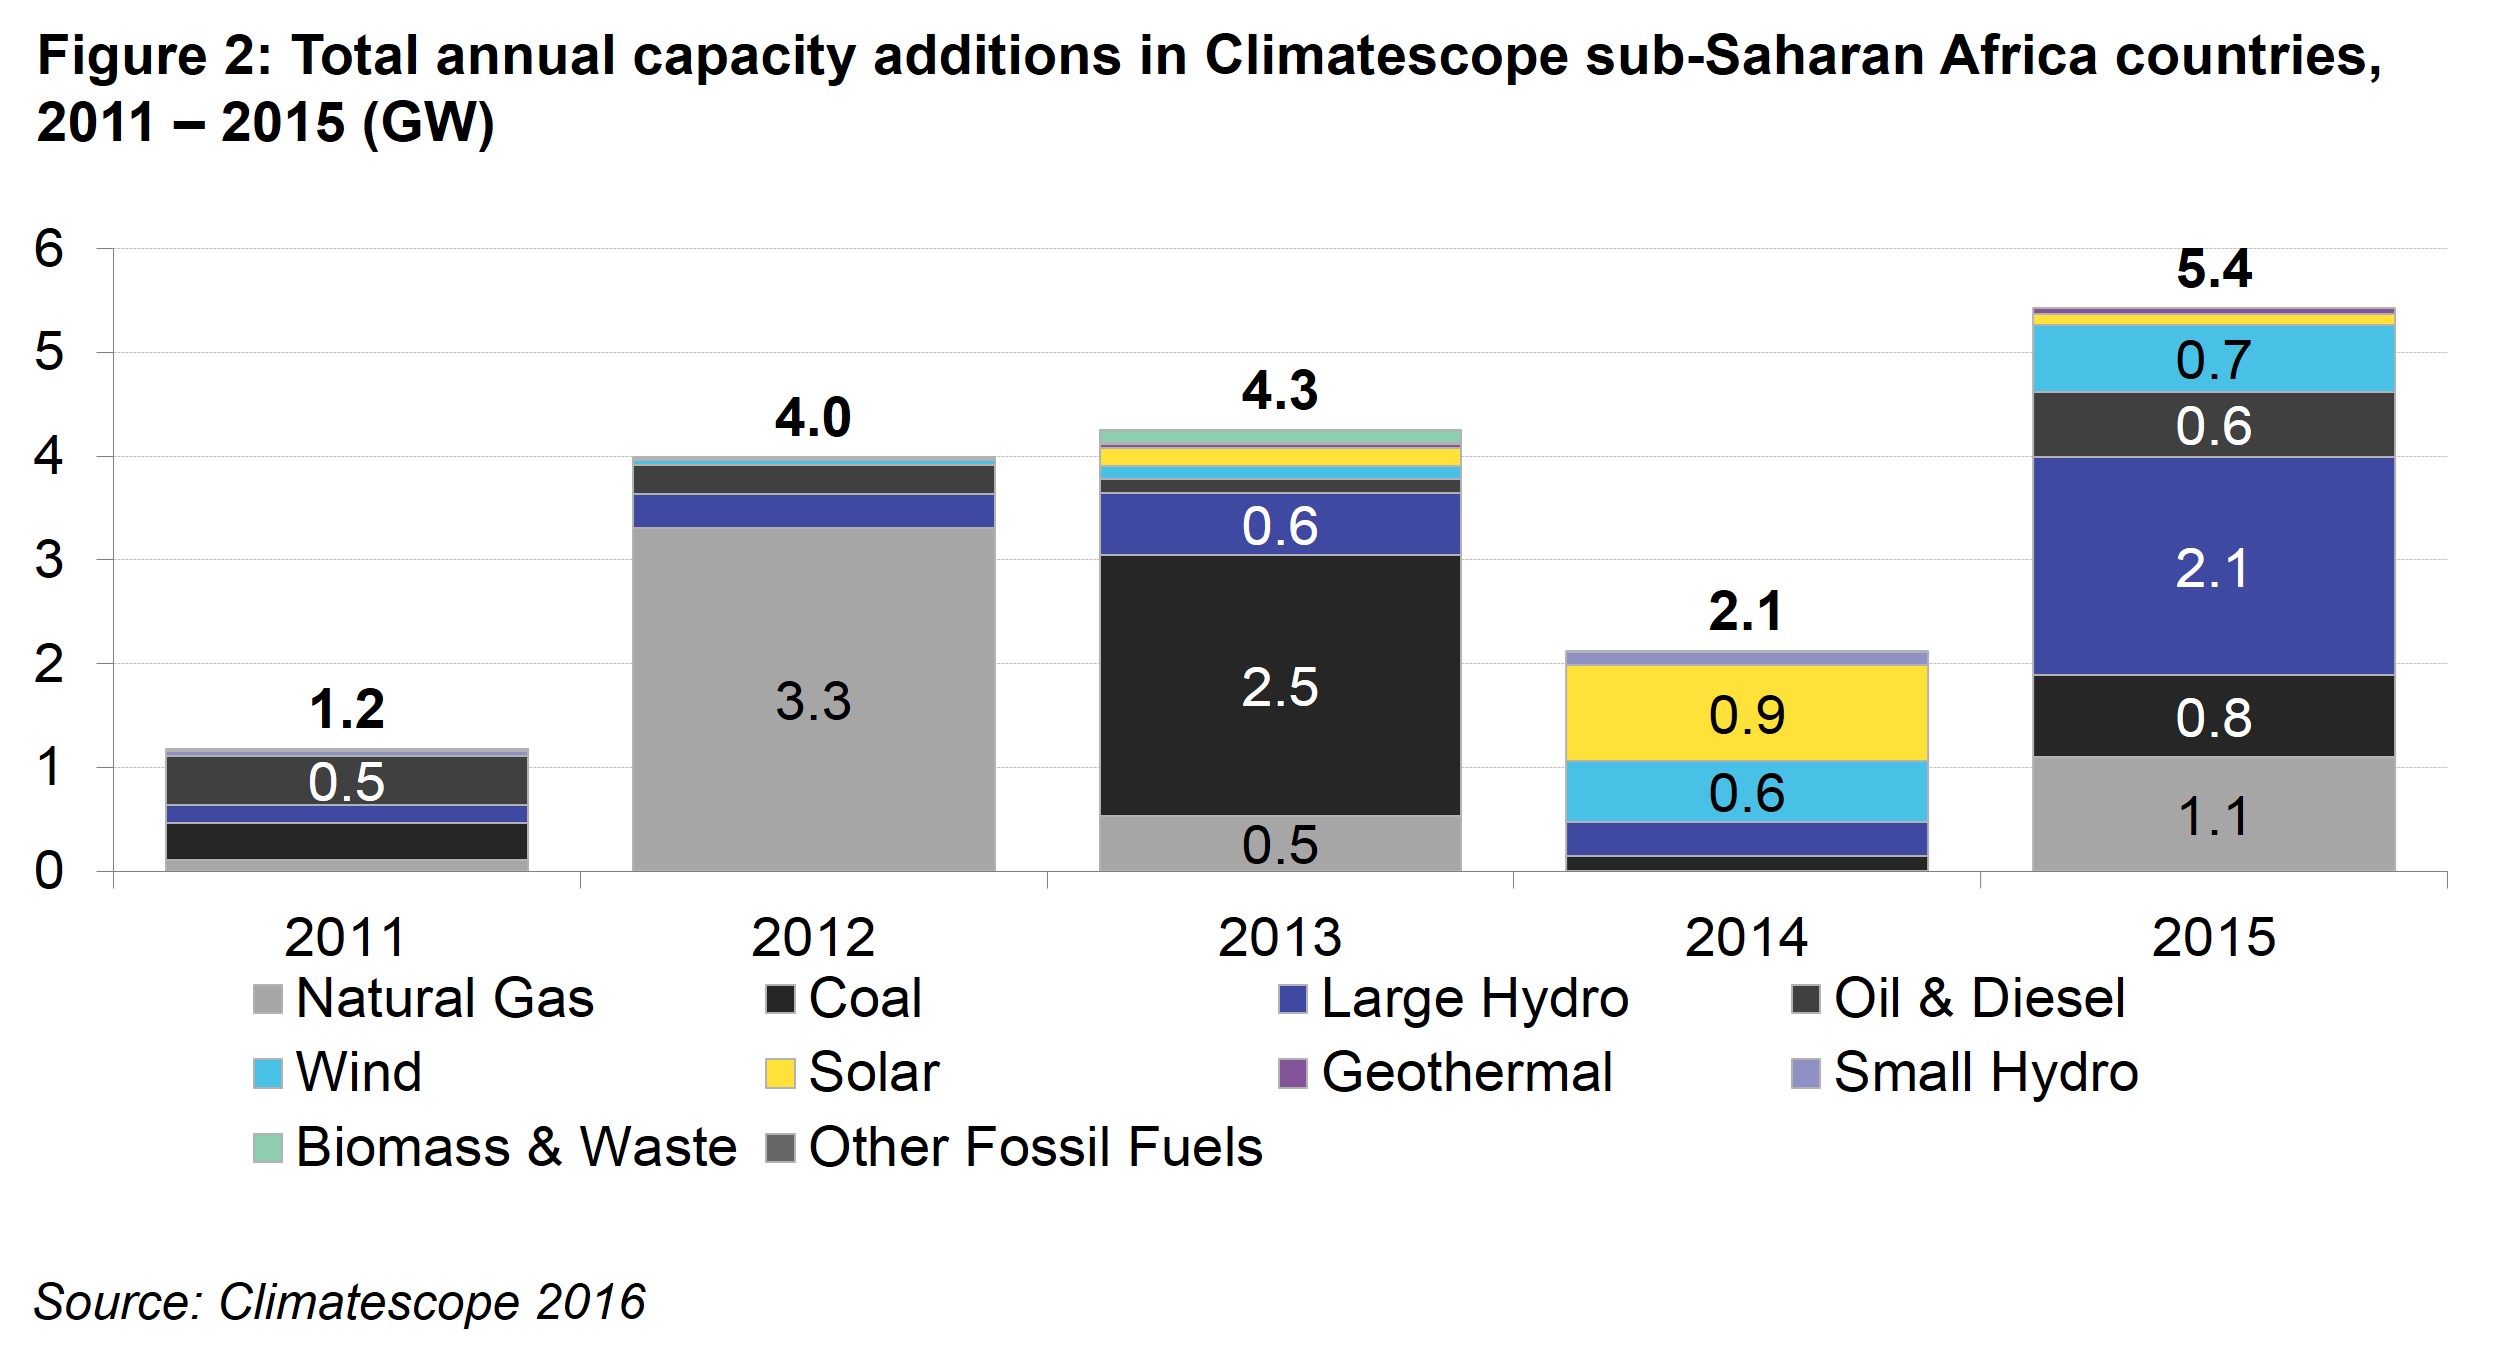
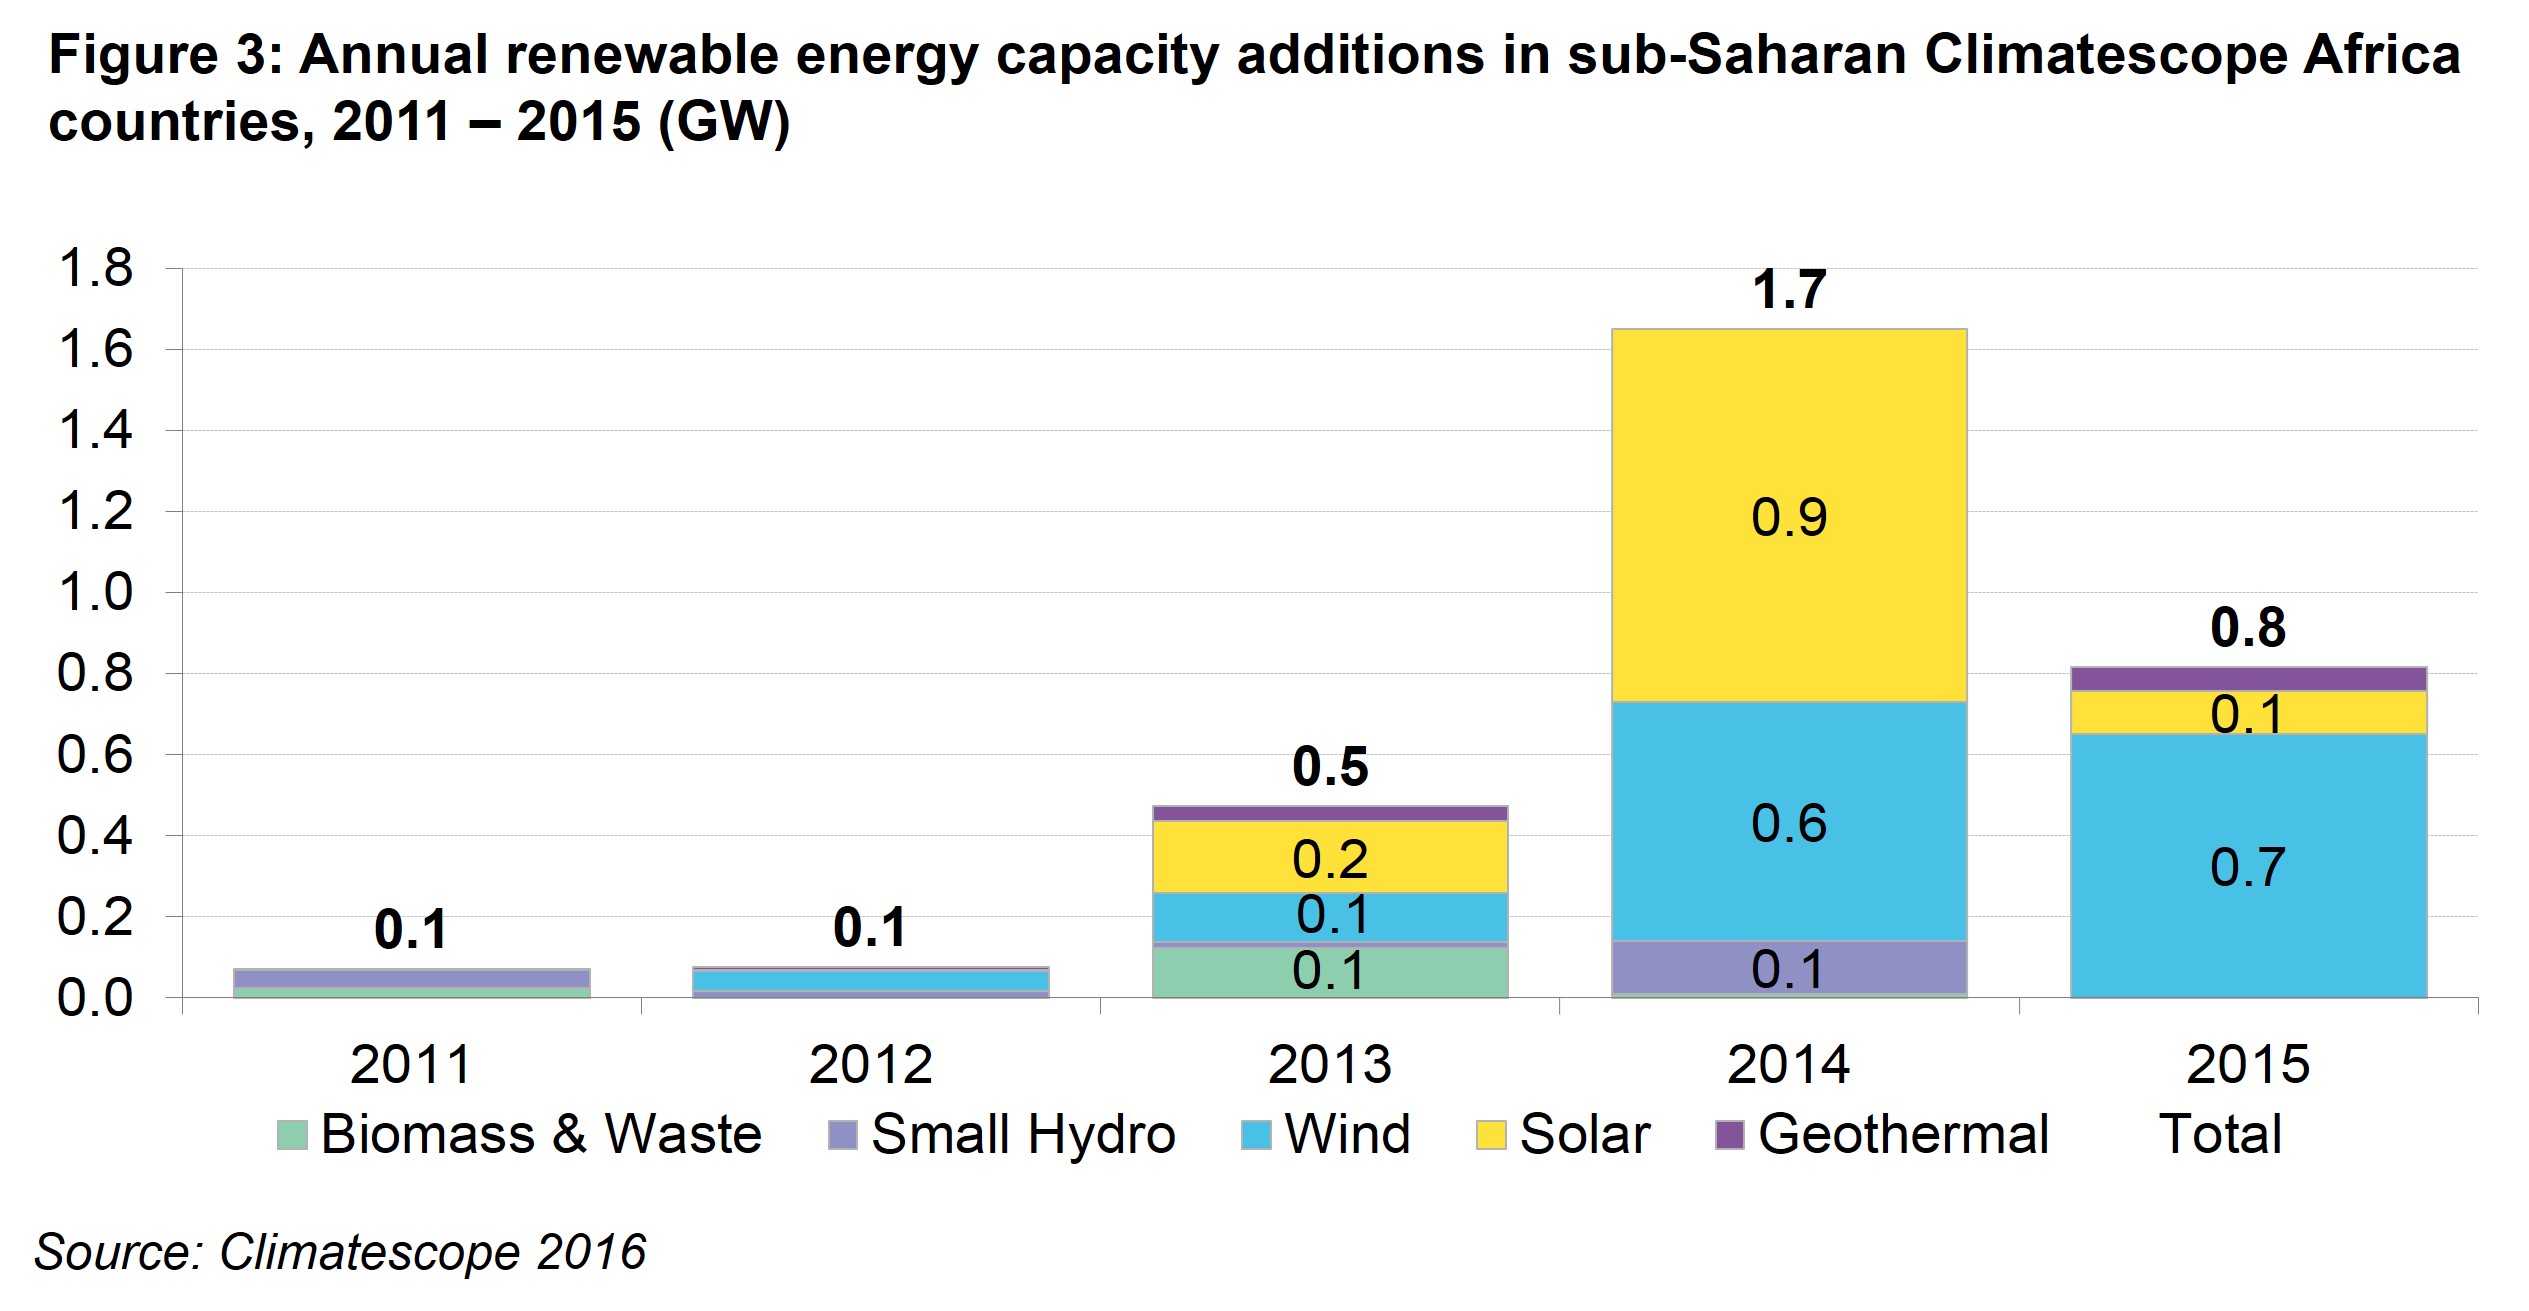
Among sub-Saharan nations, South Africa is the outlier. The country has 845MW of installed capacity for every million inhabitants. It is also home to more than half of the regional Climatescope countries’ total capacity and renewable capacity, with 43.7GW and 2.6GW, respectively. Annual capacity additions in sub-Saharan Africa are quite uneven due to the relatively small size of the region’s power systems. In fact, the commissioning of a single project or two can have major impact on the region’s overall figures for a year (Figure 2 and Figure 3). This explains what would otherwise appear to be a significant slowdown in solar projects commissioning in South Africa, which dropped from 909MW in 2014, a record year for new solar thermal plant connections, to 101MW in 2015. Ethiopia, which commissioned 150MW of onshore wind in 2015, nearly doubling its cumulative wind capacity since 2010, is second only to South Africa in terms of new installations. Kenya’s geothermal sector consolidated its standing as a global leader, adding 58MW and raising total installed capacity for the technology to 740MW at the end of 2015.
Hydro, large and small, is the carbon-neutral source of electricity on which the continent currently relies most, with just under 20GW of capacity installed, 671MW of which is in South Africa. The overall reliability of generation fluctuates with the availability of water resources and the condition of hydro generators, which is often poor. The average capacity factor for hydro projects in the region stood at 53% in 2015 – far below typical hydro capacity factors, which can top 80%. In countries suffering from drought conditions, capacity factors can be much lower. In Zambia, for instance, hydro accounts for 95% of installed capacity but droughts have meant that, at best, only a third of that capacity was available in 2015.
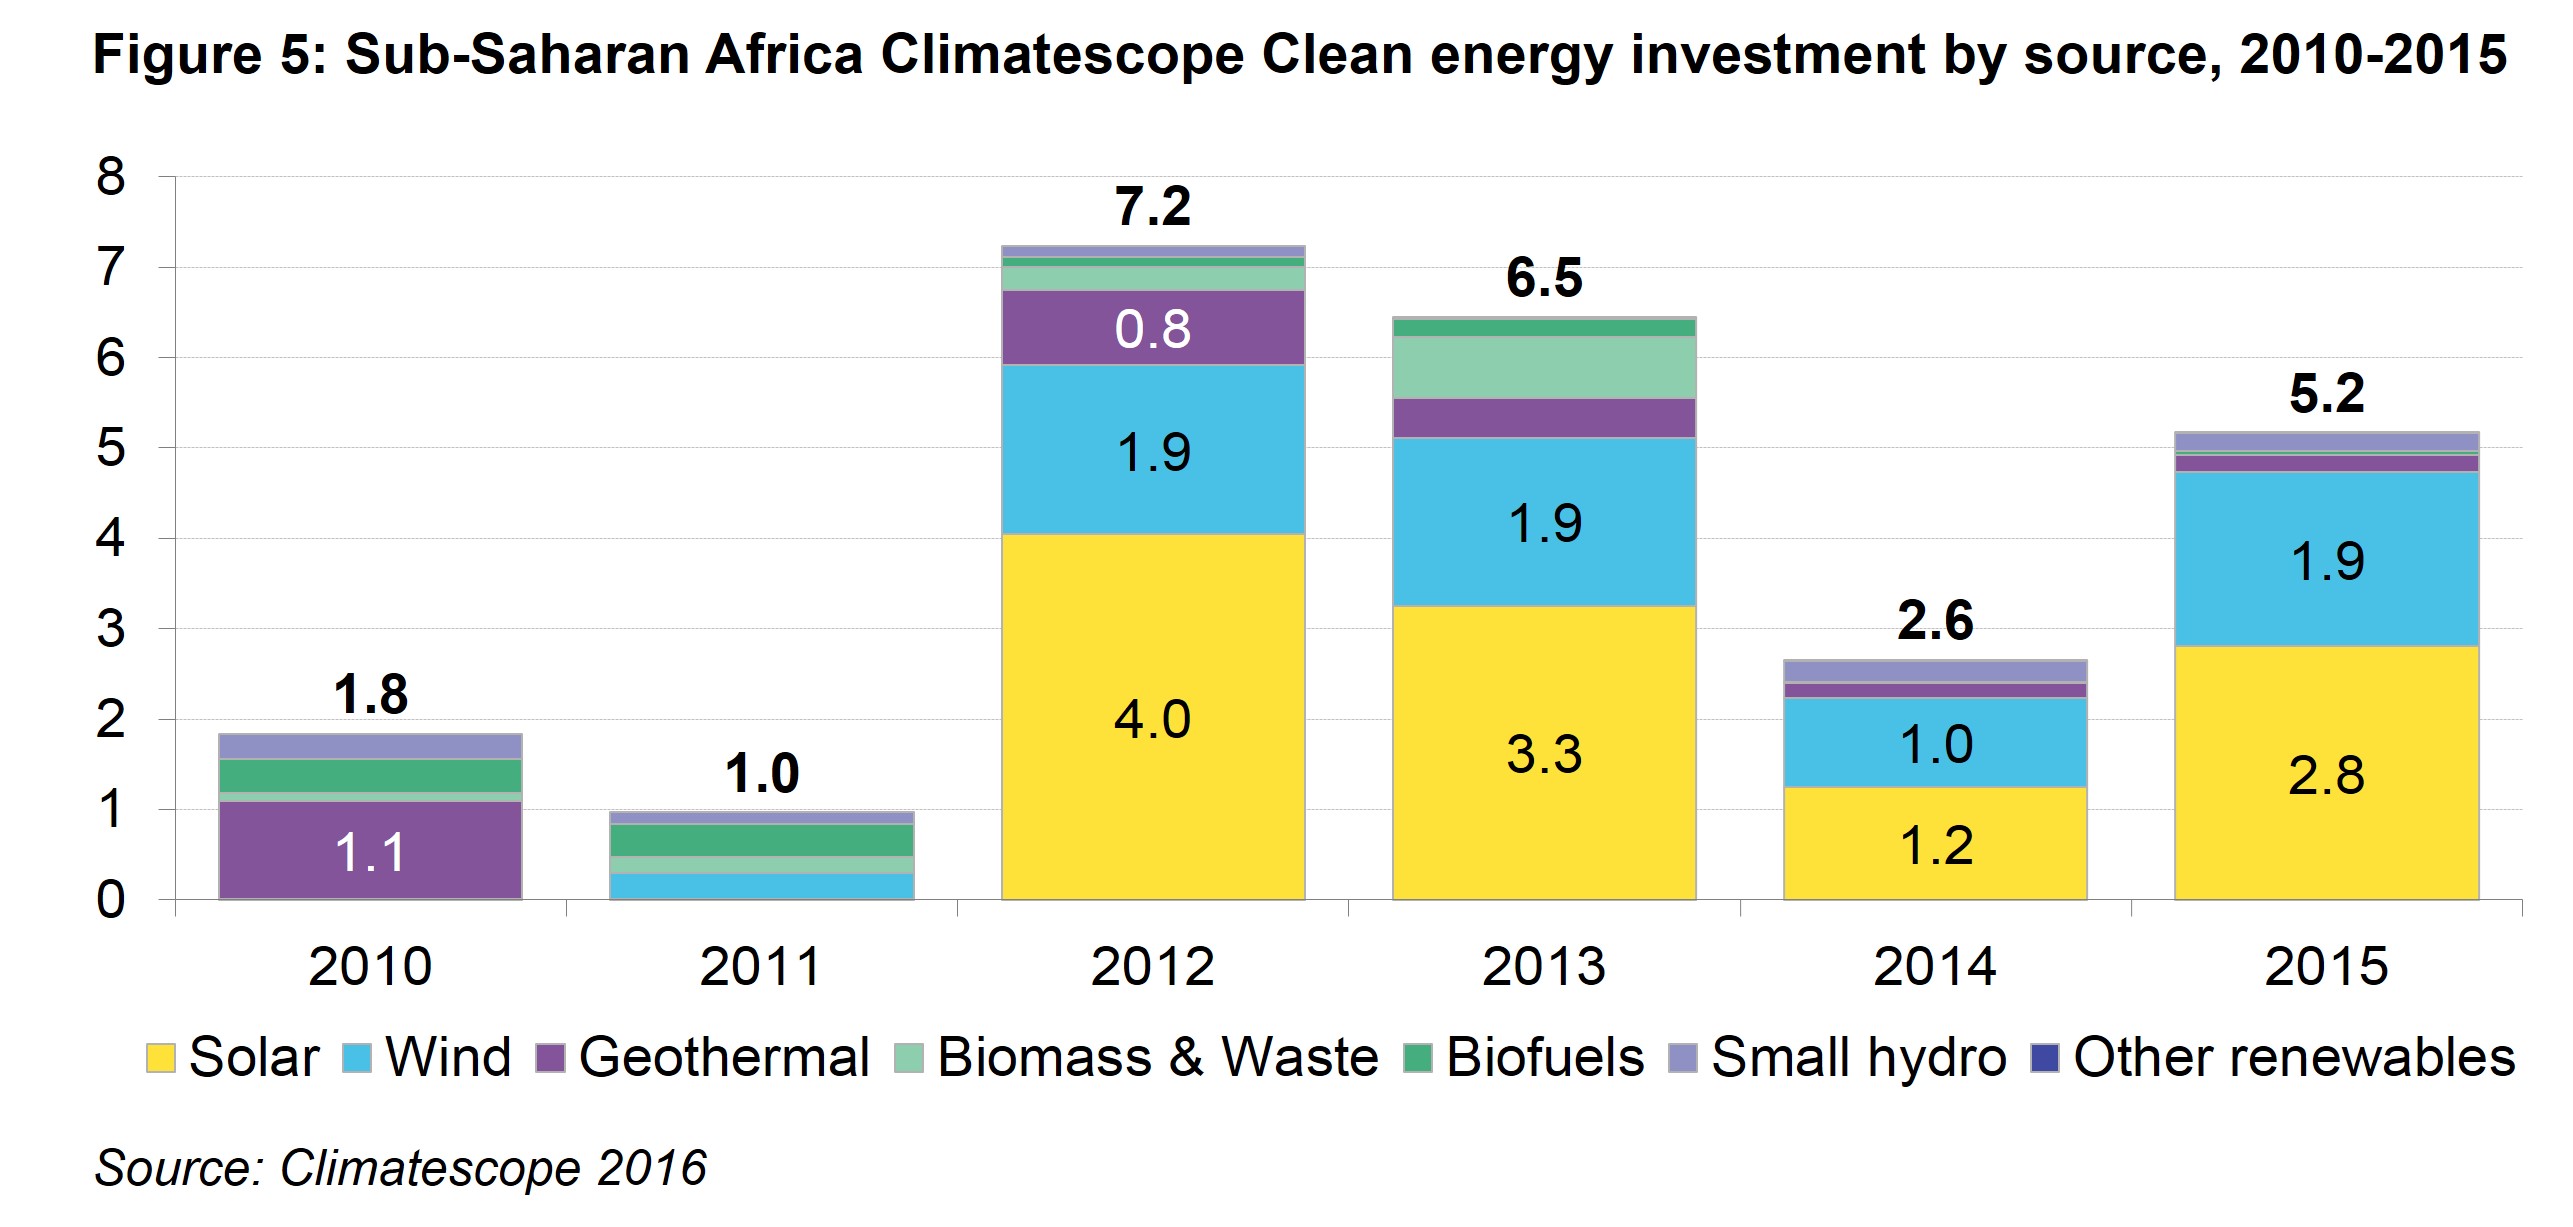
CLEAN ENERGY INVESTMENTS AND THE RISE OF SOLAR
Clean energy investment across sub-Saharan Africa nearly doubled from 2014 to 2015, rising to $5.2bn (Figure 4 and Figure 5). This was largely due to a strong performance from South Africa, where investment recovered from $1.3bn in 2014 to $4.1bn in 2015, closer to the record levels seen in 2012 and 2013. South Africa’s landmark deal in 2015 was the $1.1bn 100MW solar thermal Ilangalethu Karoshoek Solar Valley project. Other significant deals included three onshore wind farms and a solar PV portfolio, each financed for $200-400m. These deals confirmed South Africa’s status as one of the world’s top investment destinations for clean energy.
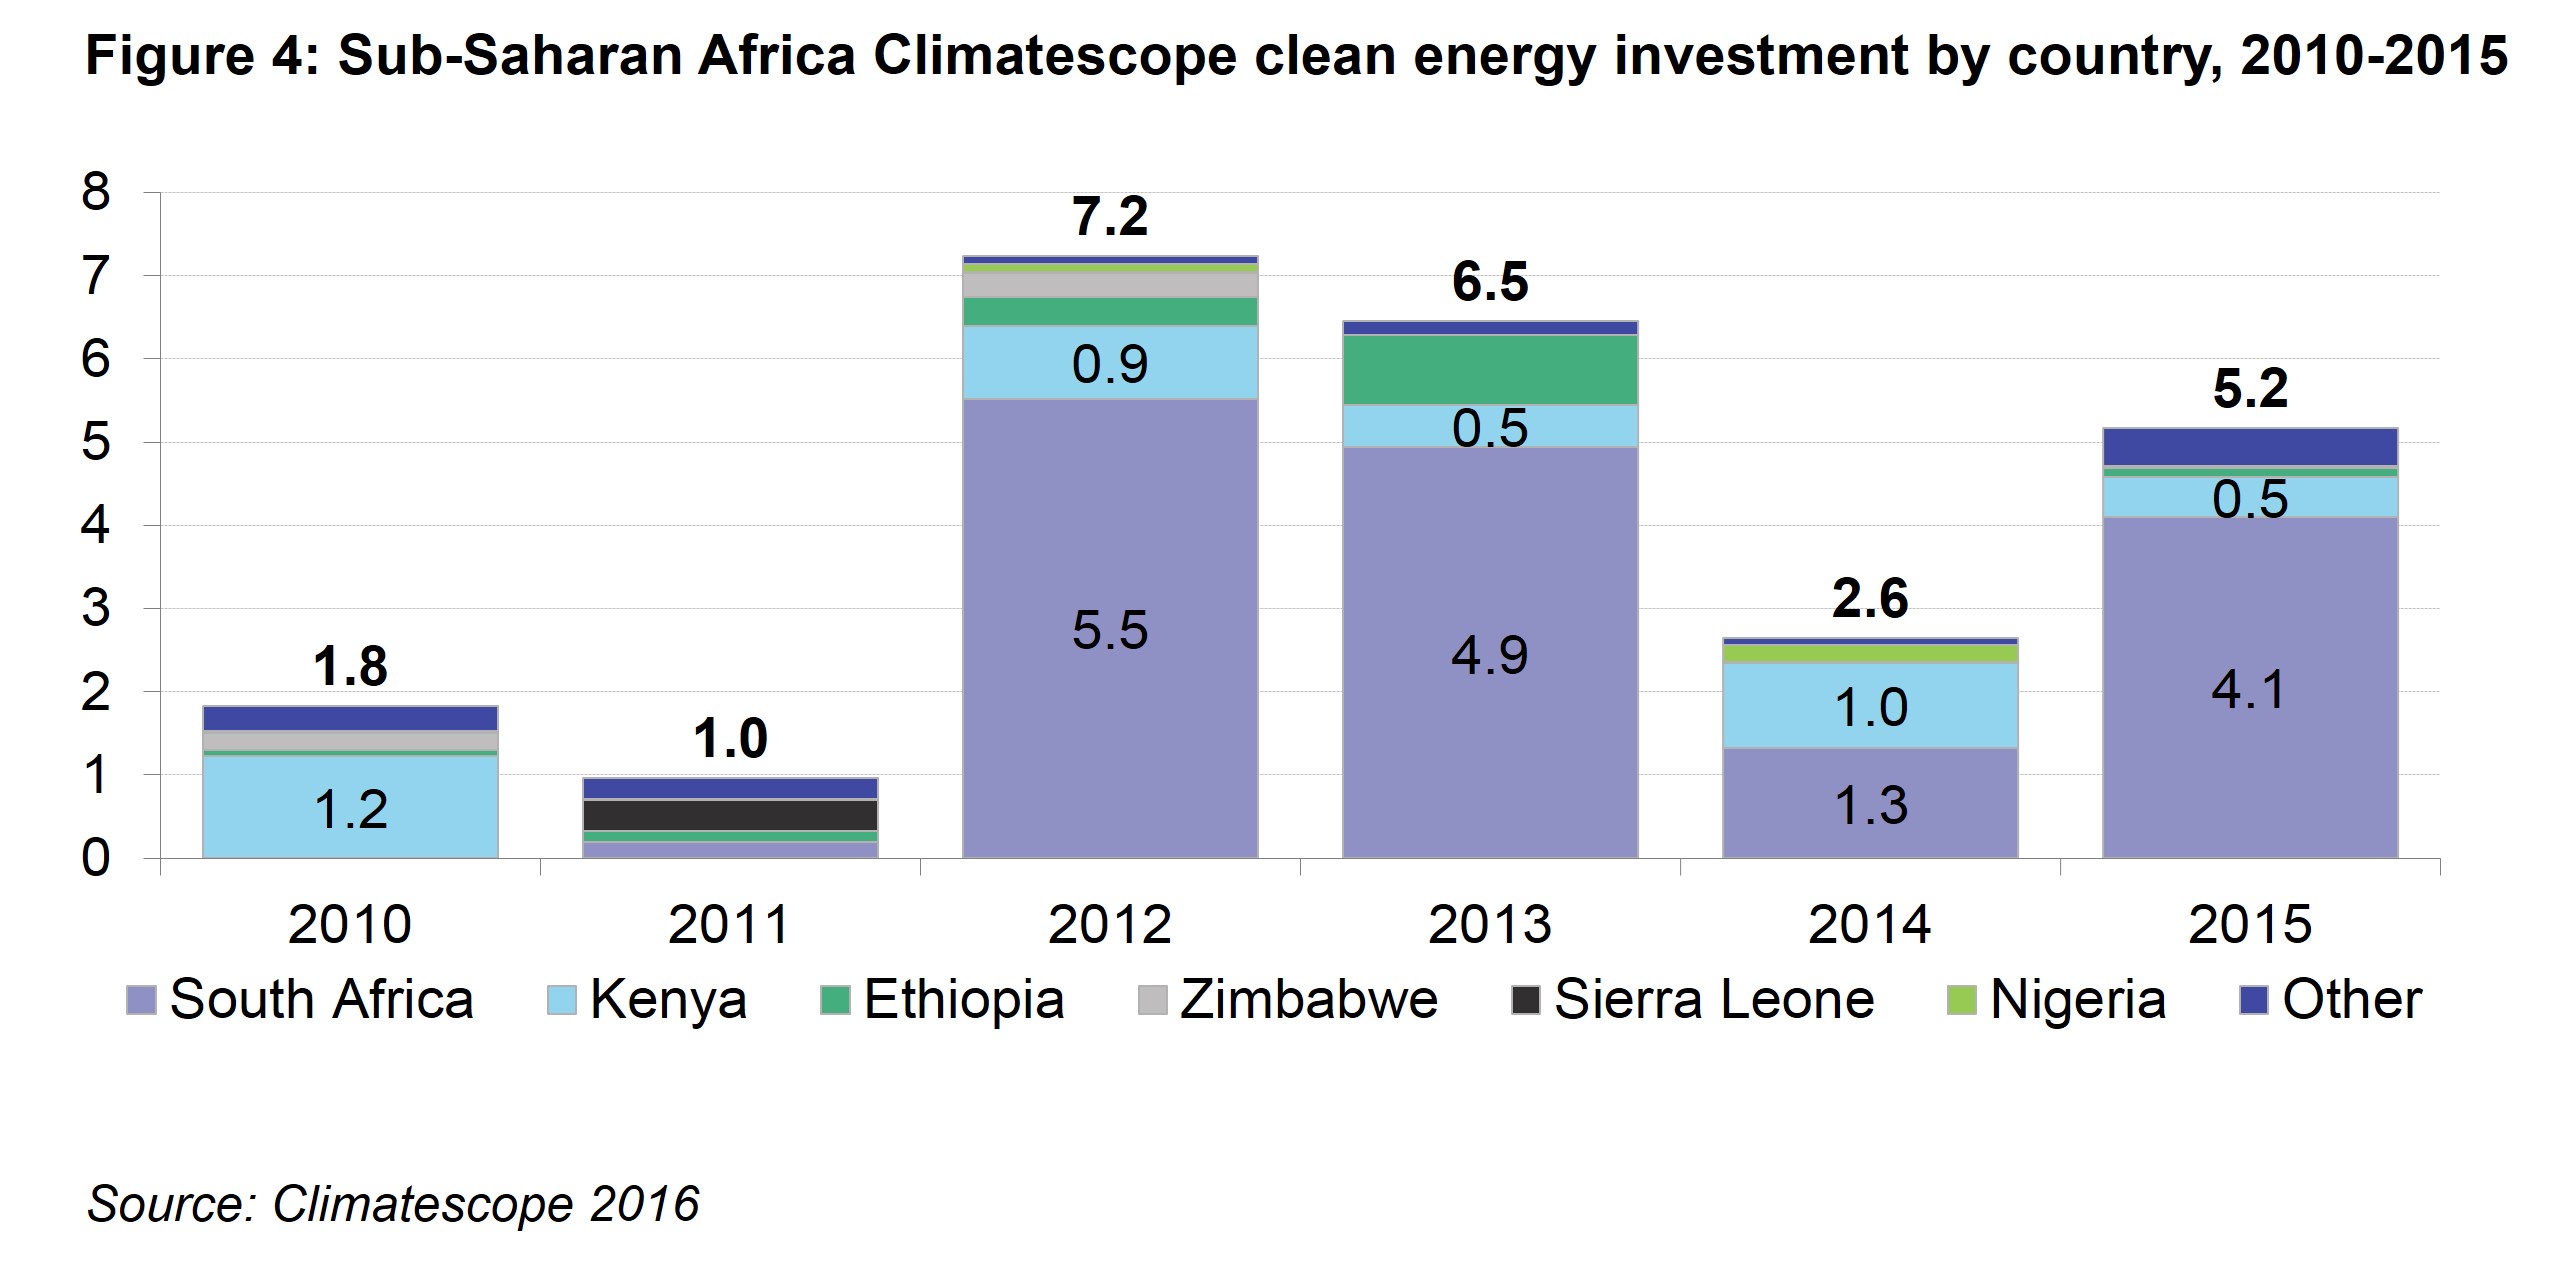
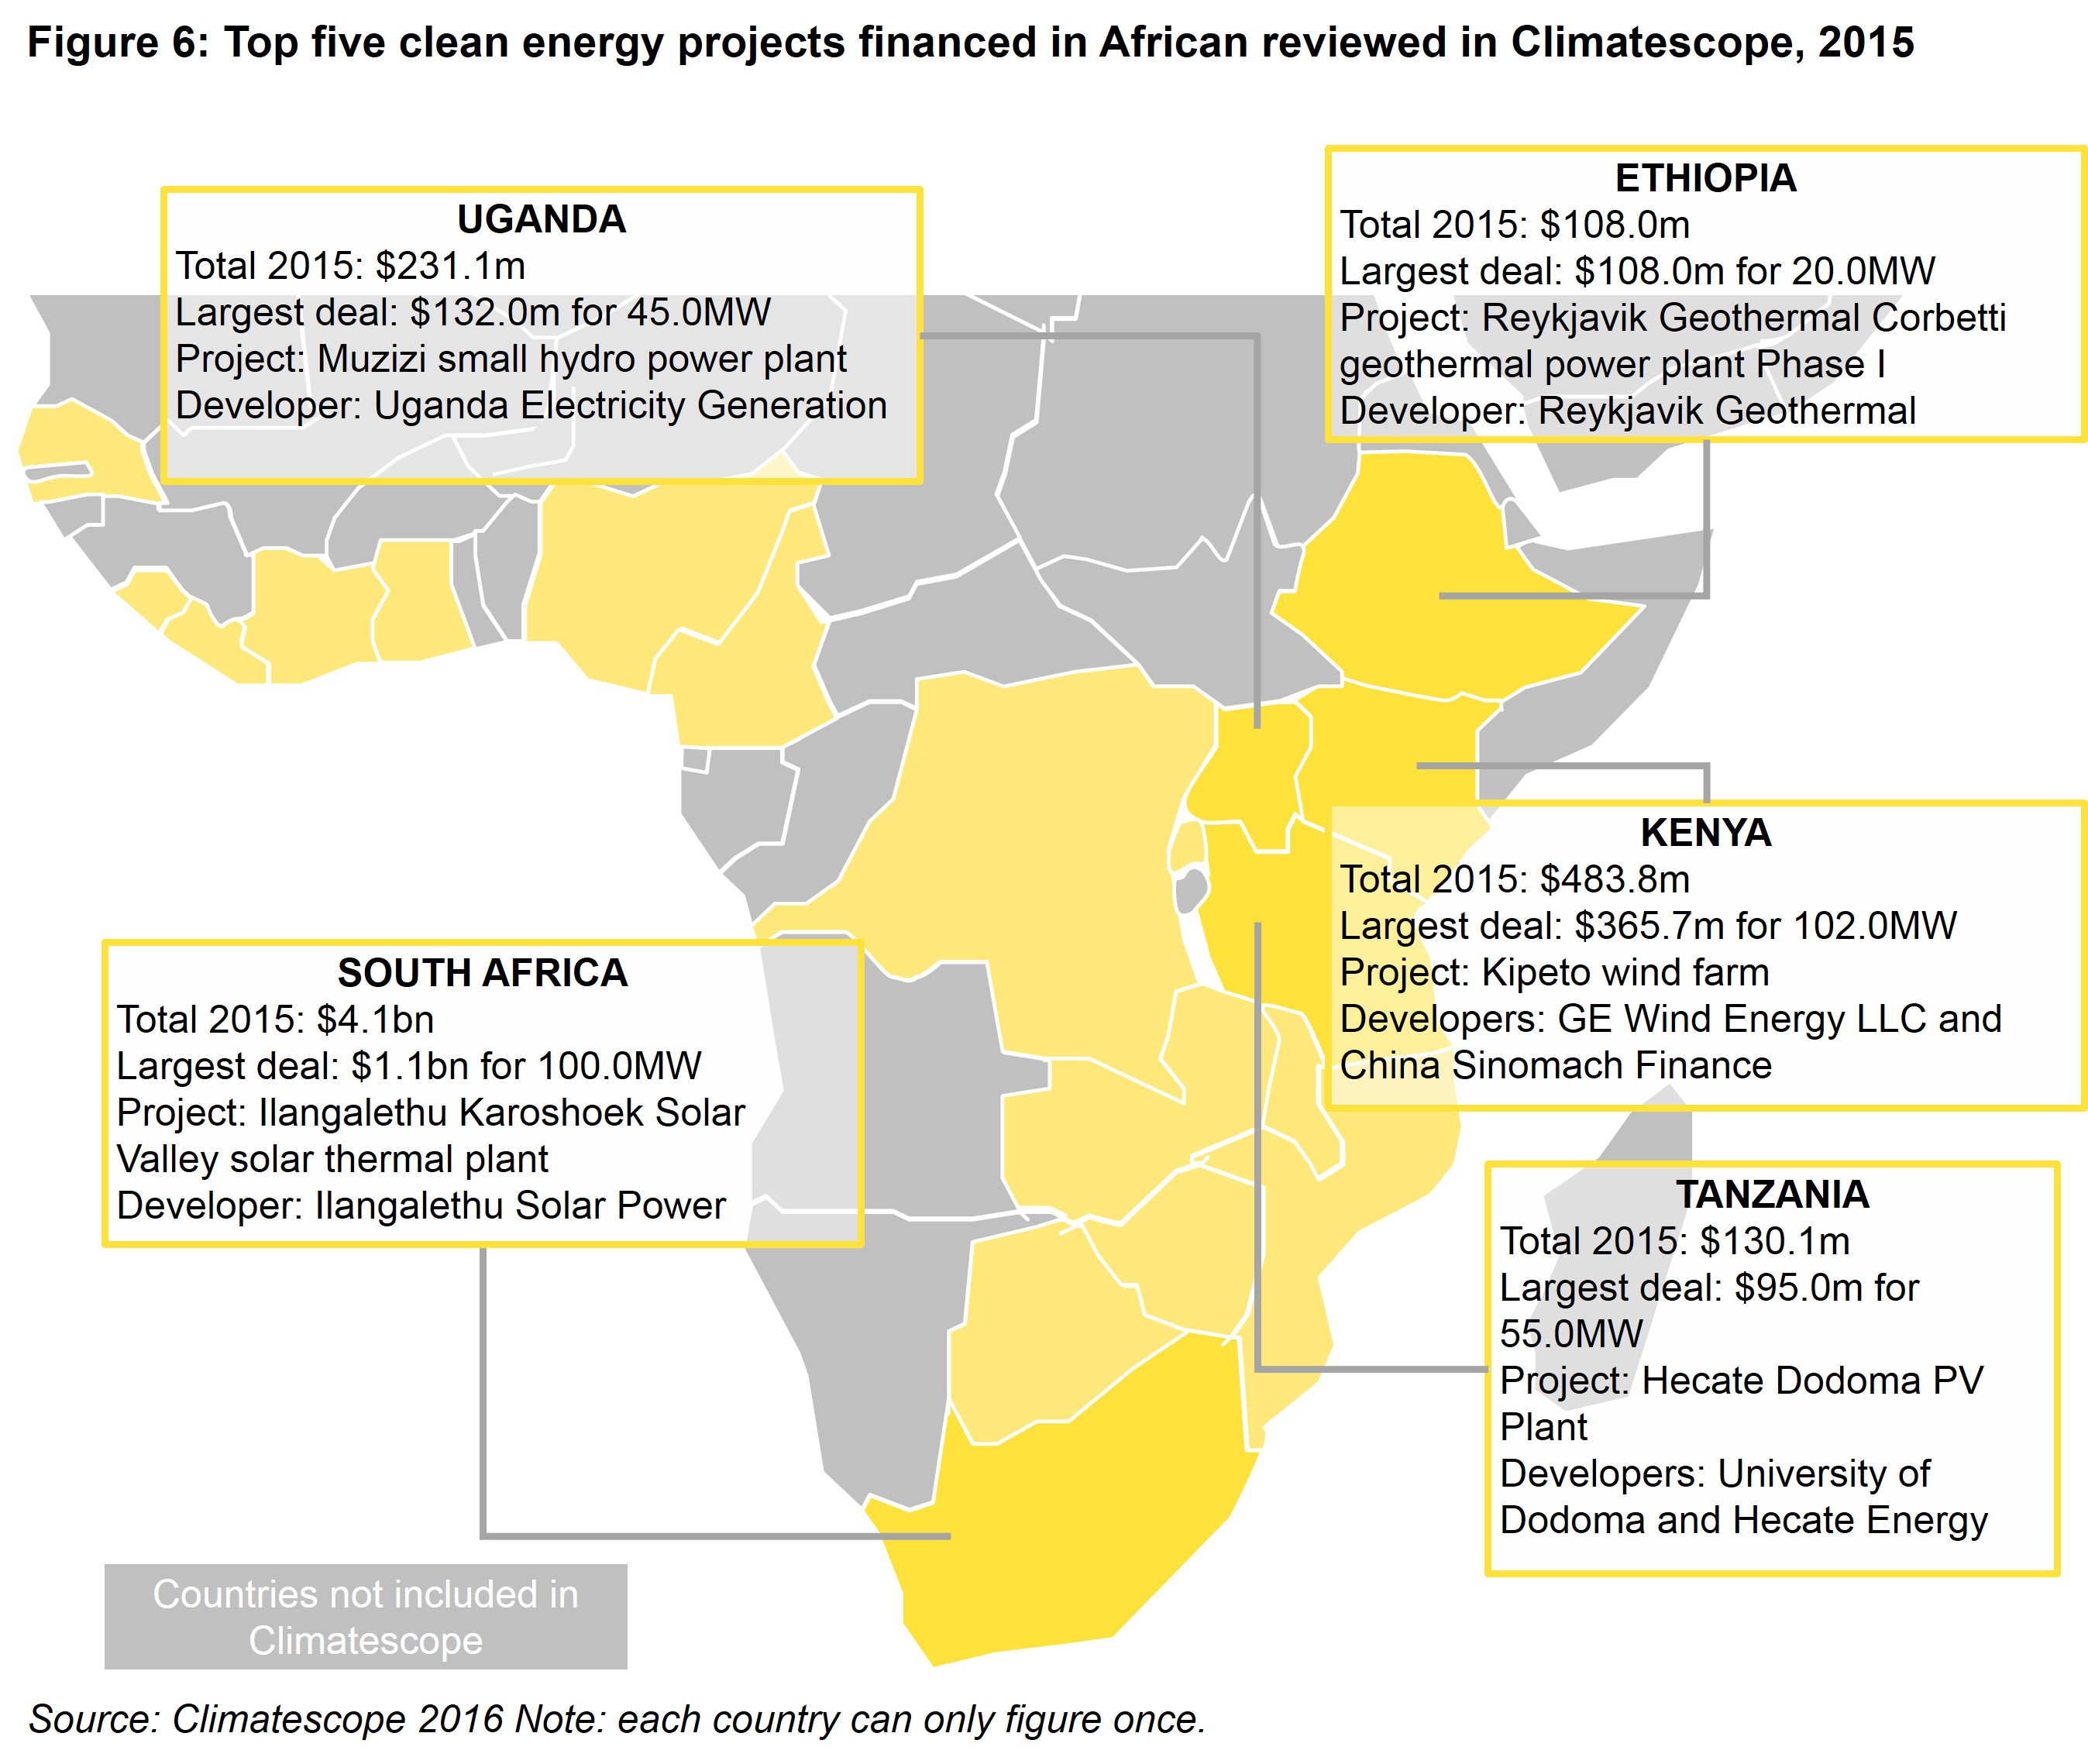
Seven other African countries reviewed in Climatescope attracted new investment in 2015. The $316m financing of the 100MW Kipeto onshore wind farm in Kenya’s was another record-breaking deal for the country following the conclusion of the $859m Lake Turkana wind project financing in 2014. Ghana, Senegal and Uganda enabled Sub-Saharan Africa to post an all-time record year for new asset finance in the solar PV sector outside of South Africa. Together, they attracted a combined estimated $160m in investment for 110MW of solar PV projects.
All of this marked a remarkable step up for the region, considering just 12MW of solar PV secured financing in 2014 and 56MW in 2013. This acceleration is set to continue in 2016, with 145MW of solar PV already tracked by Bloomberg New Energy Finance as of Q3 (South Africa excluded). Senegal continues to make progress on its pipeline, with 80MW of solar PV and 158MW of onshore wind financed in the first three quarters of 2016.
Activity in Ethiopia’s geothermal sector also continued in 2015 with the $100m financing of the first phase of Reykjavik Geothermal’s Corbetti power plant. The year 2015 was good for new investment in clean energy across Sub-Saharan Africa, with deals exceeding $95m recorded in four countries outside South Africa (Figure 6). Finally, private equity and venture capital flows into off-grid solar accelerated from 2014 to 2015. Off-grid electrification companies in Kenya’s, Tanzania and Zimbabwe received approximately $80m in 2015, more than four times the amount recorded in 2014, confirming the emergence of East Africa as the global leading region in the sector.
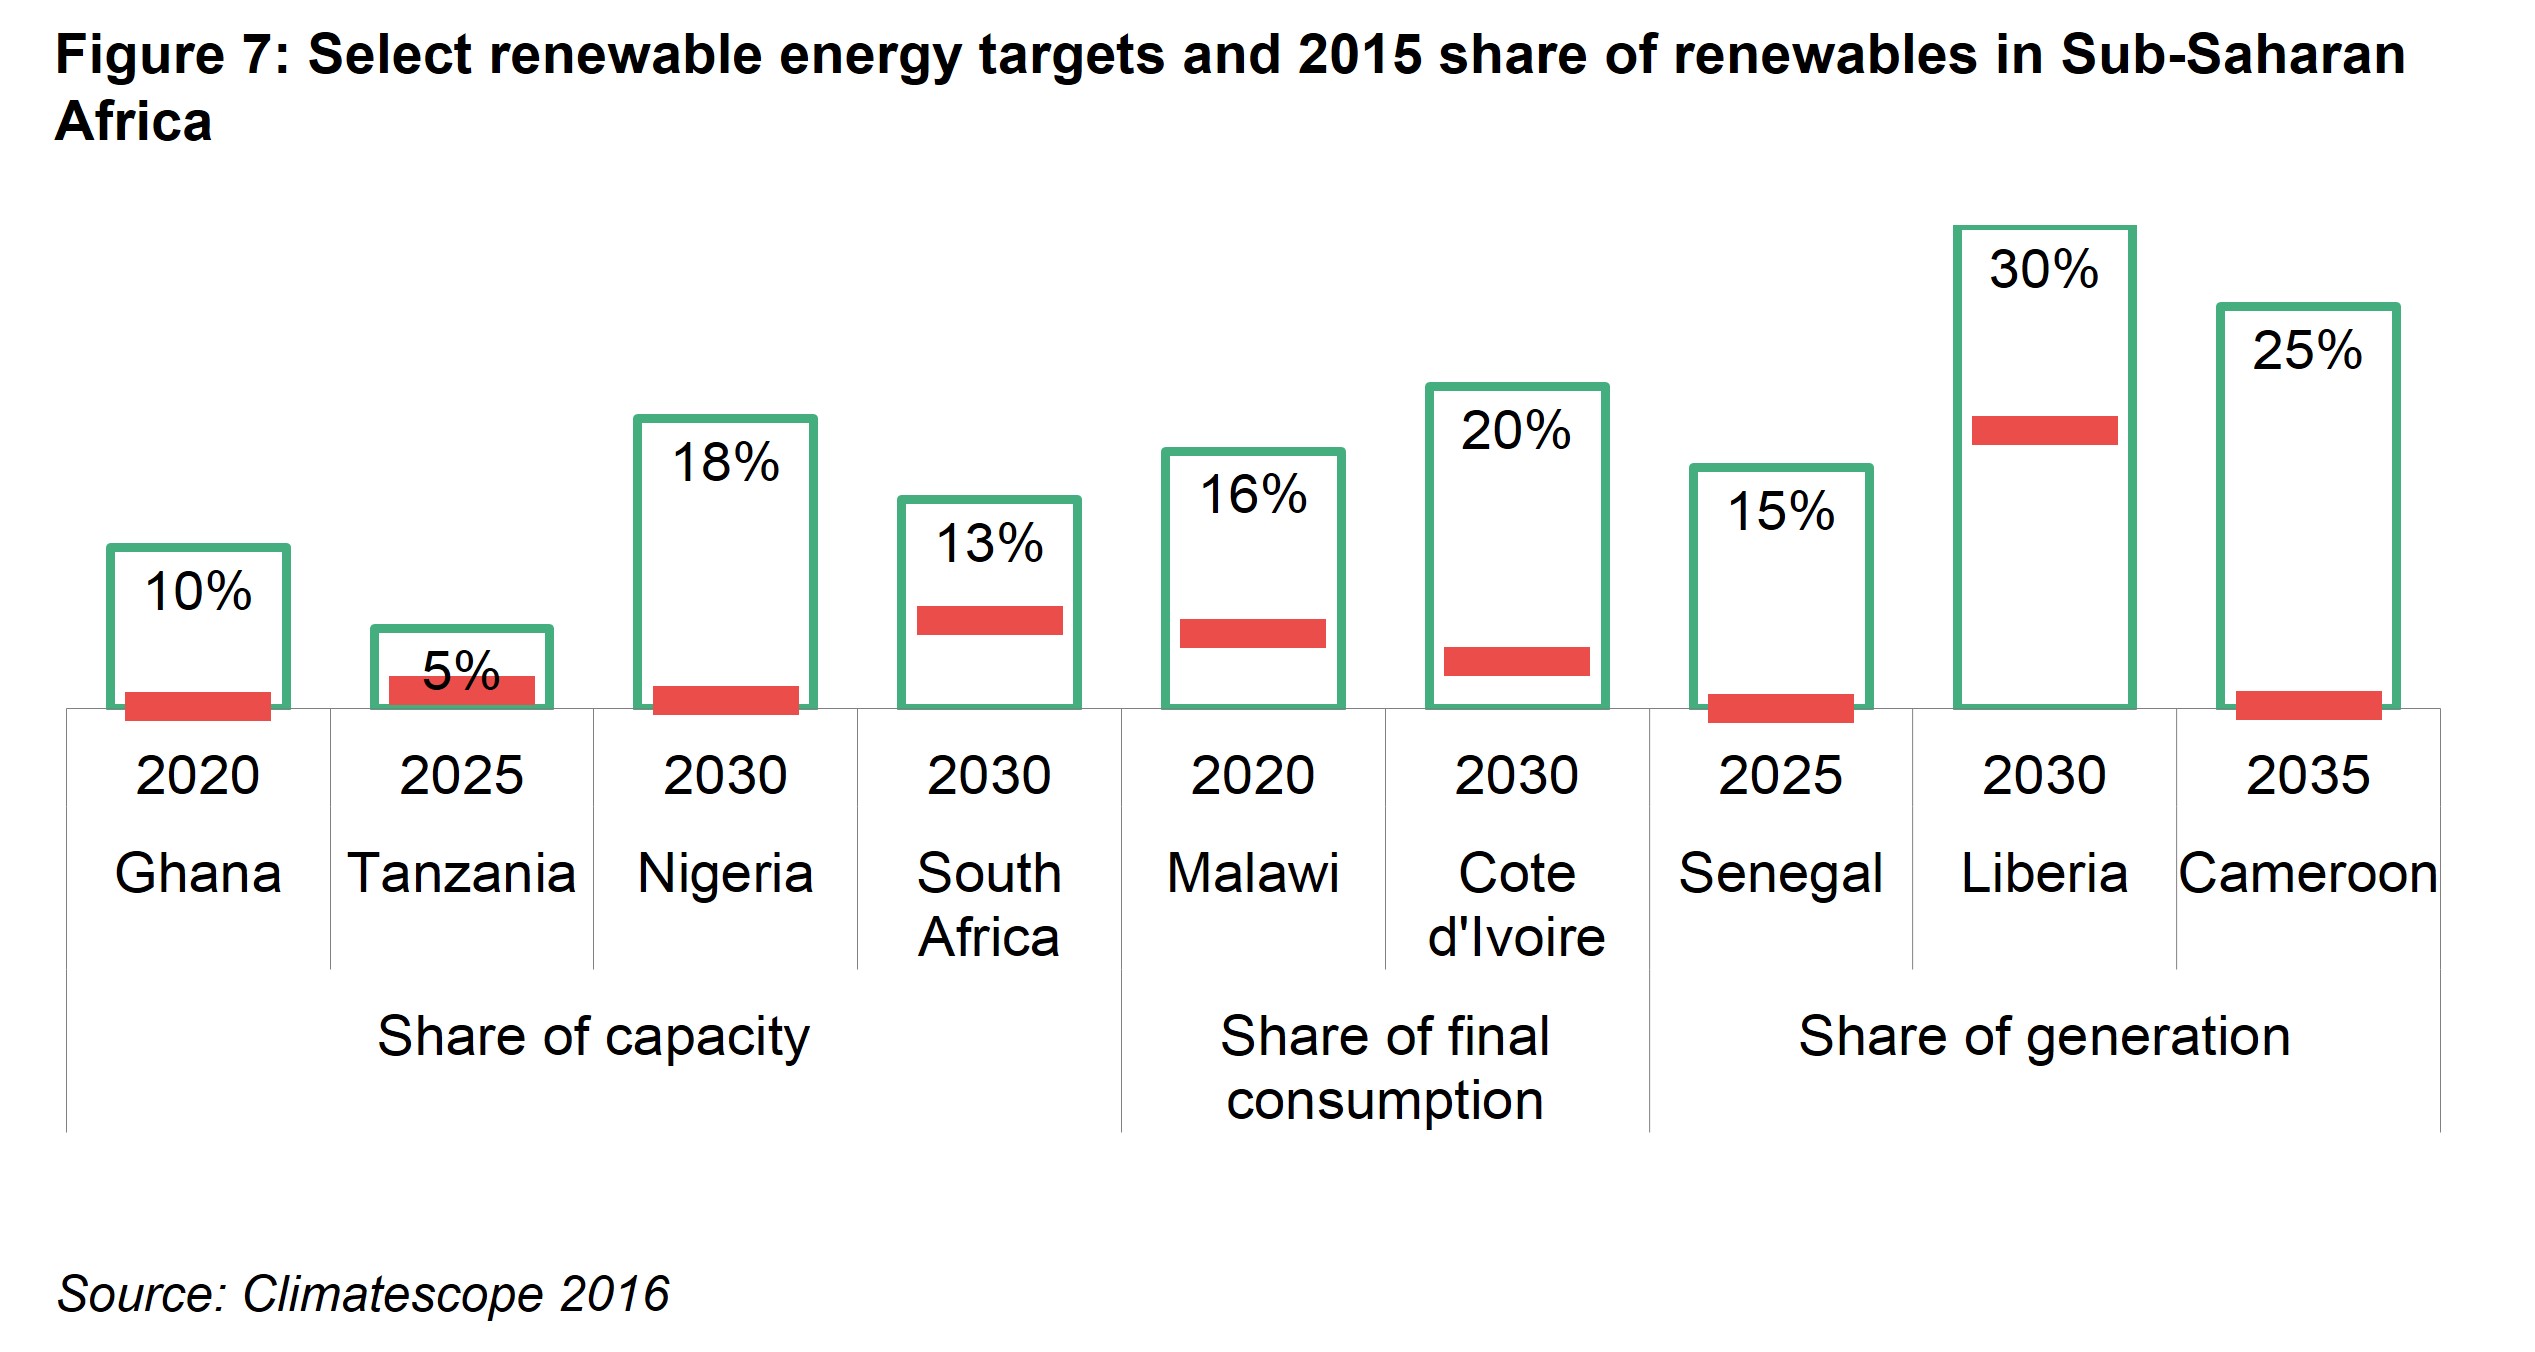
THE ROLE OF RENEWABLES IN GOVERNMENT OBJECTIVES IS GROWING
Clean energy policies are becoming more widely adopted across Sub-Saharan Africa. Fourteen of 19 Climatescope countries from the region have set domestic renewable energy build targets. Specifically, the negotiations that culminated in governments signing the Paris climate pact in late 2015 have prompted African nations to commit to clean energy targets or to update their existing commitments (see Parameter I summary). The overall target levels are ambitious in a number of markets, especially when considering the current contribution of renewables to the power mix (Figure 7).
Some targets have also become more sophisticated. For example, the government of Rwanda has been working on an update of its electrification plan that includes a new breakdown of electrification targets by off-grid systems and mini-grids. As before, Rwanda aims to reach an installed capacity of 563MW, up from just over 170MW, and 70% of electrification, both by 2018.
While the overall trend appears positive, there are countries that have not reviewed the ambition of their targets, which remain relatively low. Tanzania only plans to install 100MW of solar, 200MW of geothermal and 200MW of onshore wind by 2025 against a complete power-generating matrix of 10.7GW.
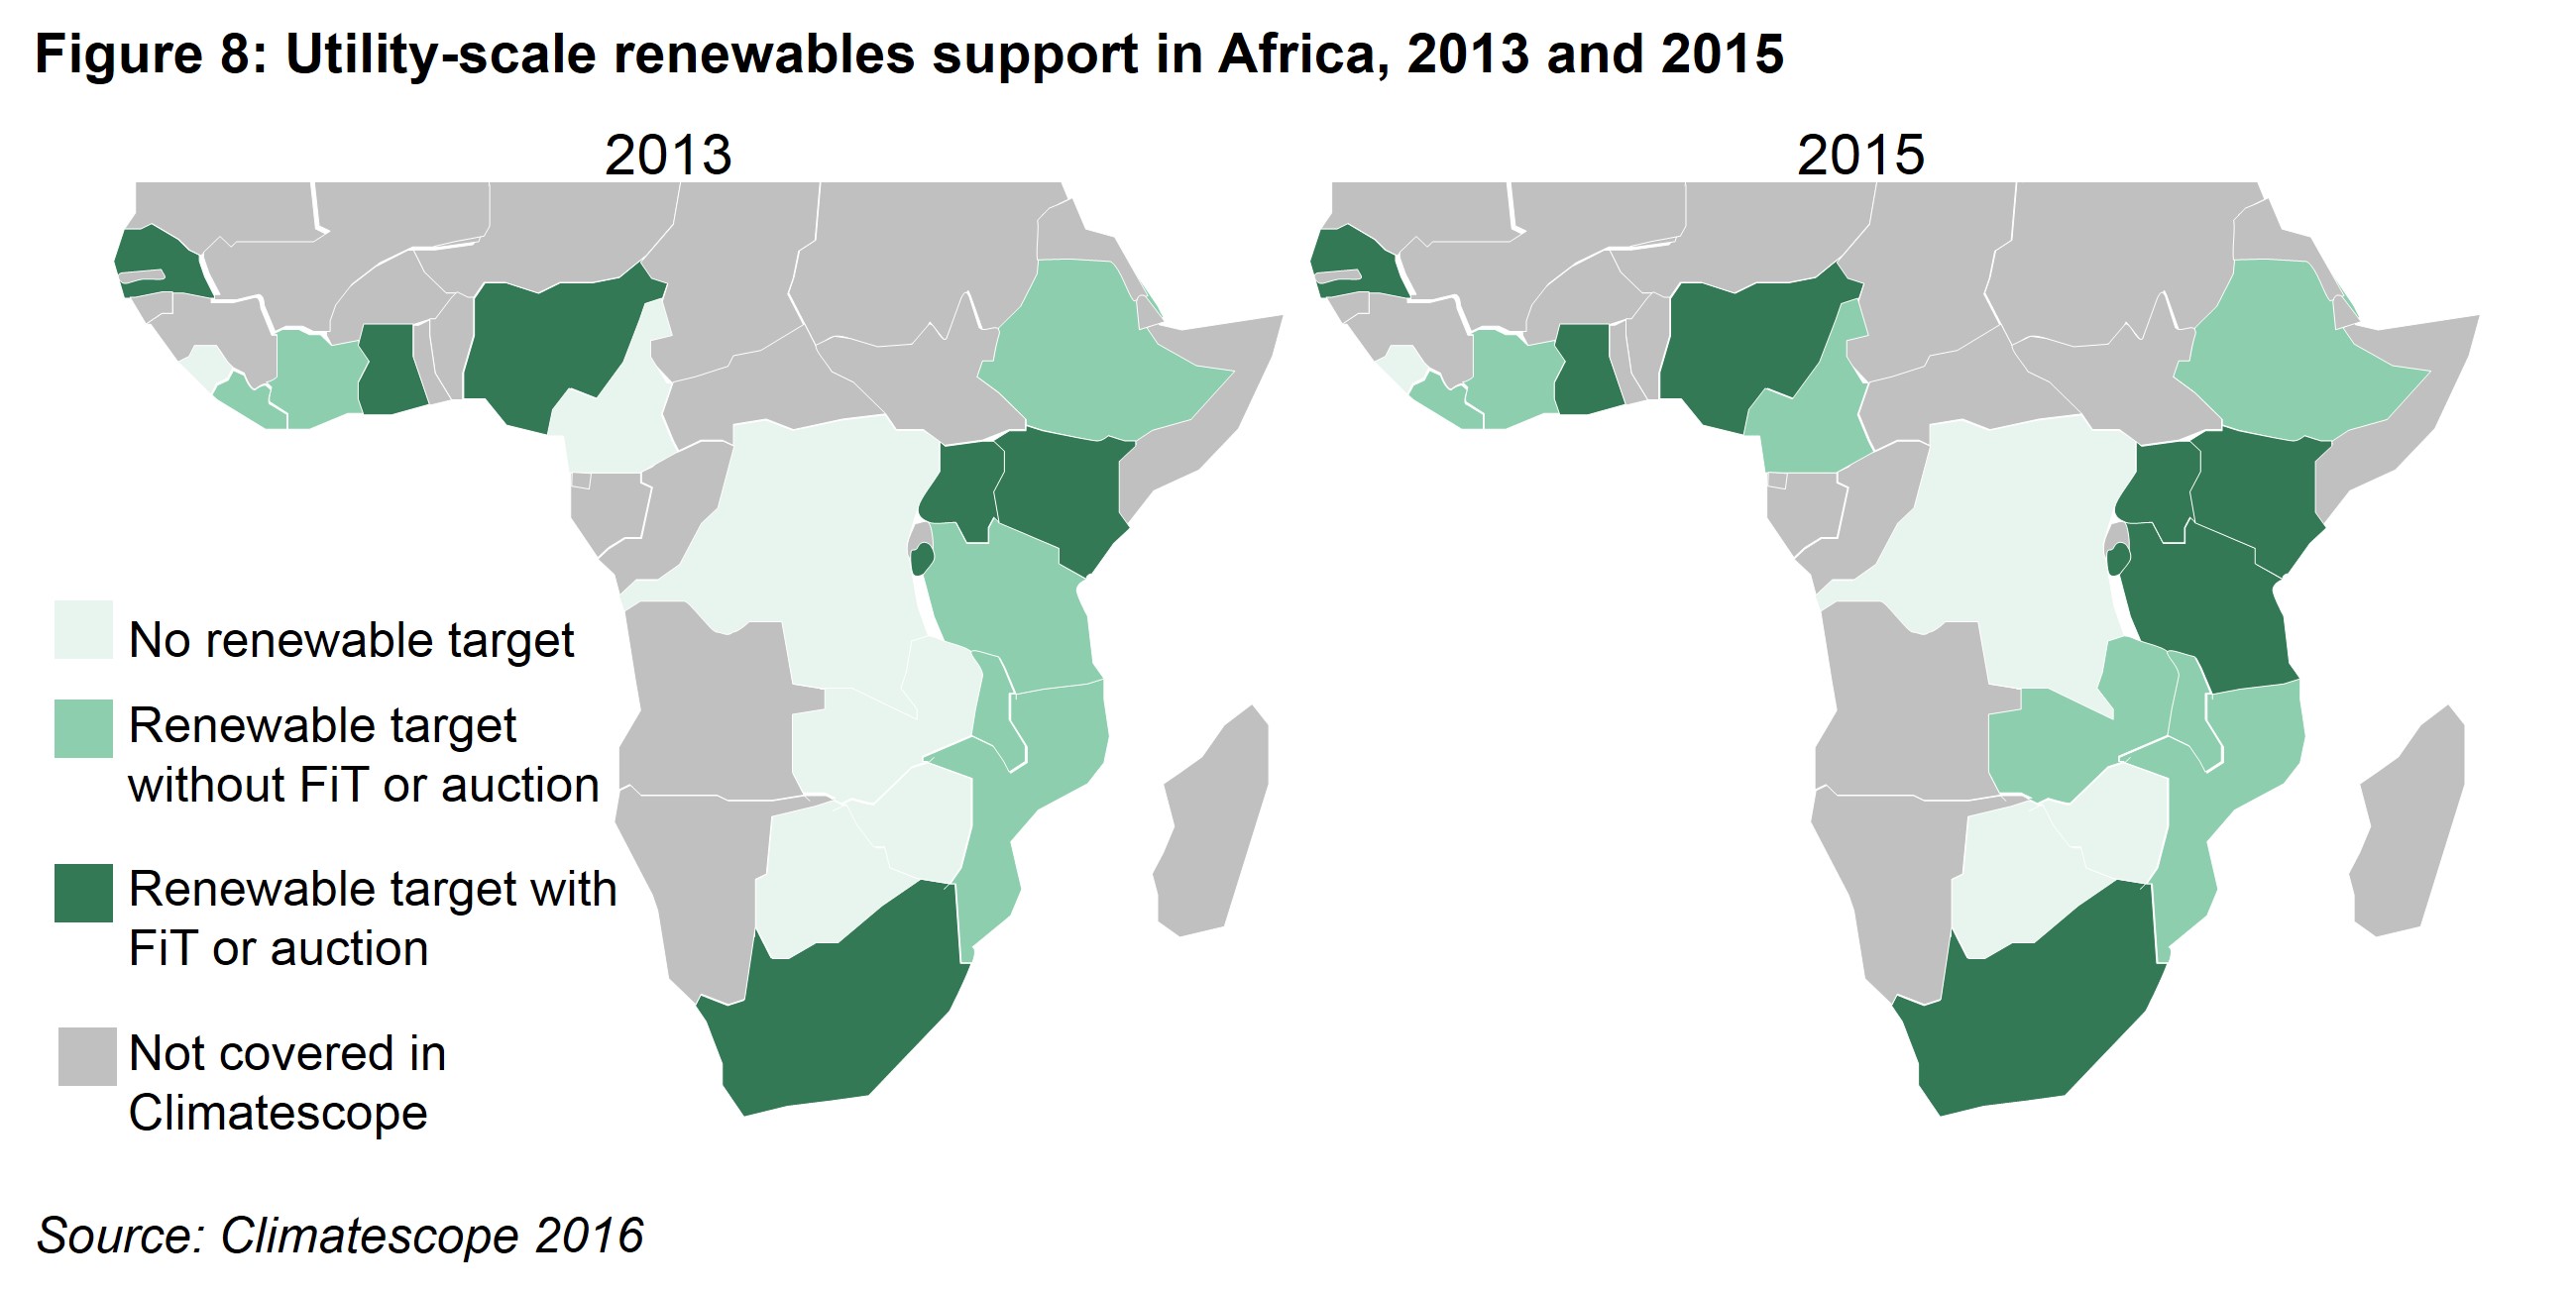
Meeting those objectives will also require governments to establish supporting policies, as well as to ensure the existence of power markets and physical systems to support renewables growth. Nearly two thirds of the sub-Saharan African countries reviewed in Climatescope either have no target, or have targets without feed-in tariffs, auction or other forms of support policies in place to ensure they are met (Figure 8).
Clean energy equipment is partly or completely exempted from taxation or import duties in all Sub-Saharan Africa countries reviewed in Climatescope, with the exception of Sierra Leone. However, actually securing such duty or tax exemptions is often difficult due to poor implementation or corruption. Some governments in the region are now looking to review such duty exemptions, most notably those in the East African Community, now that activity is accelerating and the associated lost revenue becomes more evident.
There have also been promising examples of countries looking to emulate the successes of South Africa’s auction program. Senegal, Ethiopia and Zambia are all part of the International Finance Corporation’s Scaling Solar initiative, which seeks to support the development of privately funded grid-connected solar projects at competitive tariffs.
The first round of tenders in Zambia was held between January and June 2016 and produced average bids of $67/MWh, with Italy’s Enel and a consortium of USA based solar manufacturer First Solar and France’s Neoen. Supported by IFC, the tenders offer successful developers risk guarantees and access to concessional financing. Nigeria has also recently committed to using auctions and will be a country to watch in Climatescope 2017.
ENERGY MARKET REORGANISATION IS MAKING SOME PROGRESS AND OFF-TAKE RISK IS INCREASINGLY BEING ADDRESSED
Energy sectors in the Sub-Saharan African markets reviewed in Climatescope tend to be dominated by single, and often state-owned utilities responsible for a large share of generation, as well as all transmission and distribution. “Unbundling” such utilities and liberalizing a country’s electricity sector are often challenging, lengthy and politicized processes.
Seven of the 19 Climatescope sub-Saharan Africa countries failed to score any points for taking action on utility unbundling in Climatescope 2016, down from 11 in the 2015 edition. New countries to take at least some action on this front include Cameroon, Mozambique, Rwanda, Sierra Leone and Tanzania. Liberia and Malawi are amongst the countries that have already introduced policies to unbundle the energy sector further in coming years. Côte d’Ivoire, Ethiopia, Ghana, Kenya, Nigeria, Senegal, Uganda and Zambia introduced some level of unbundling as of 2013.
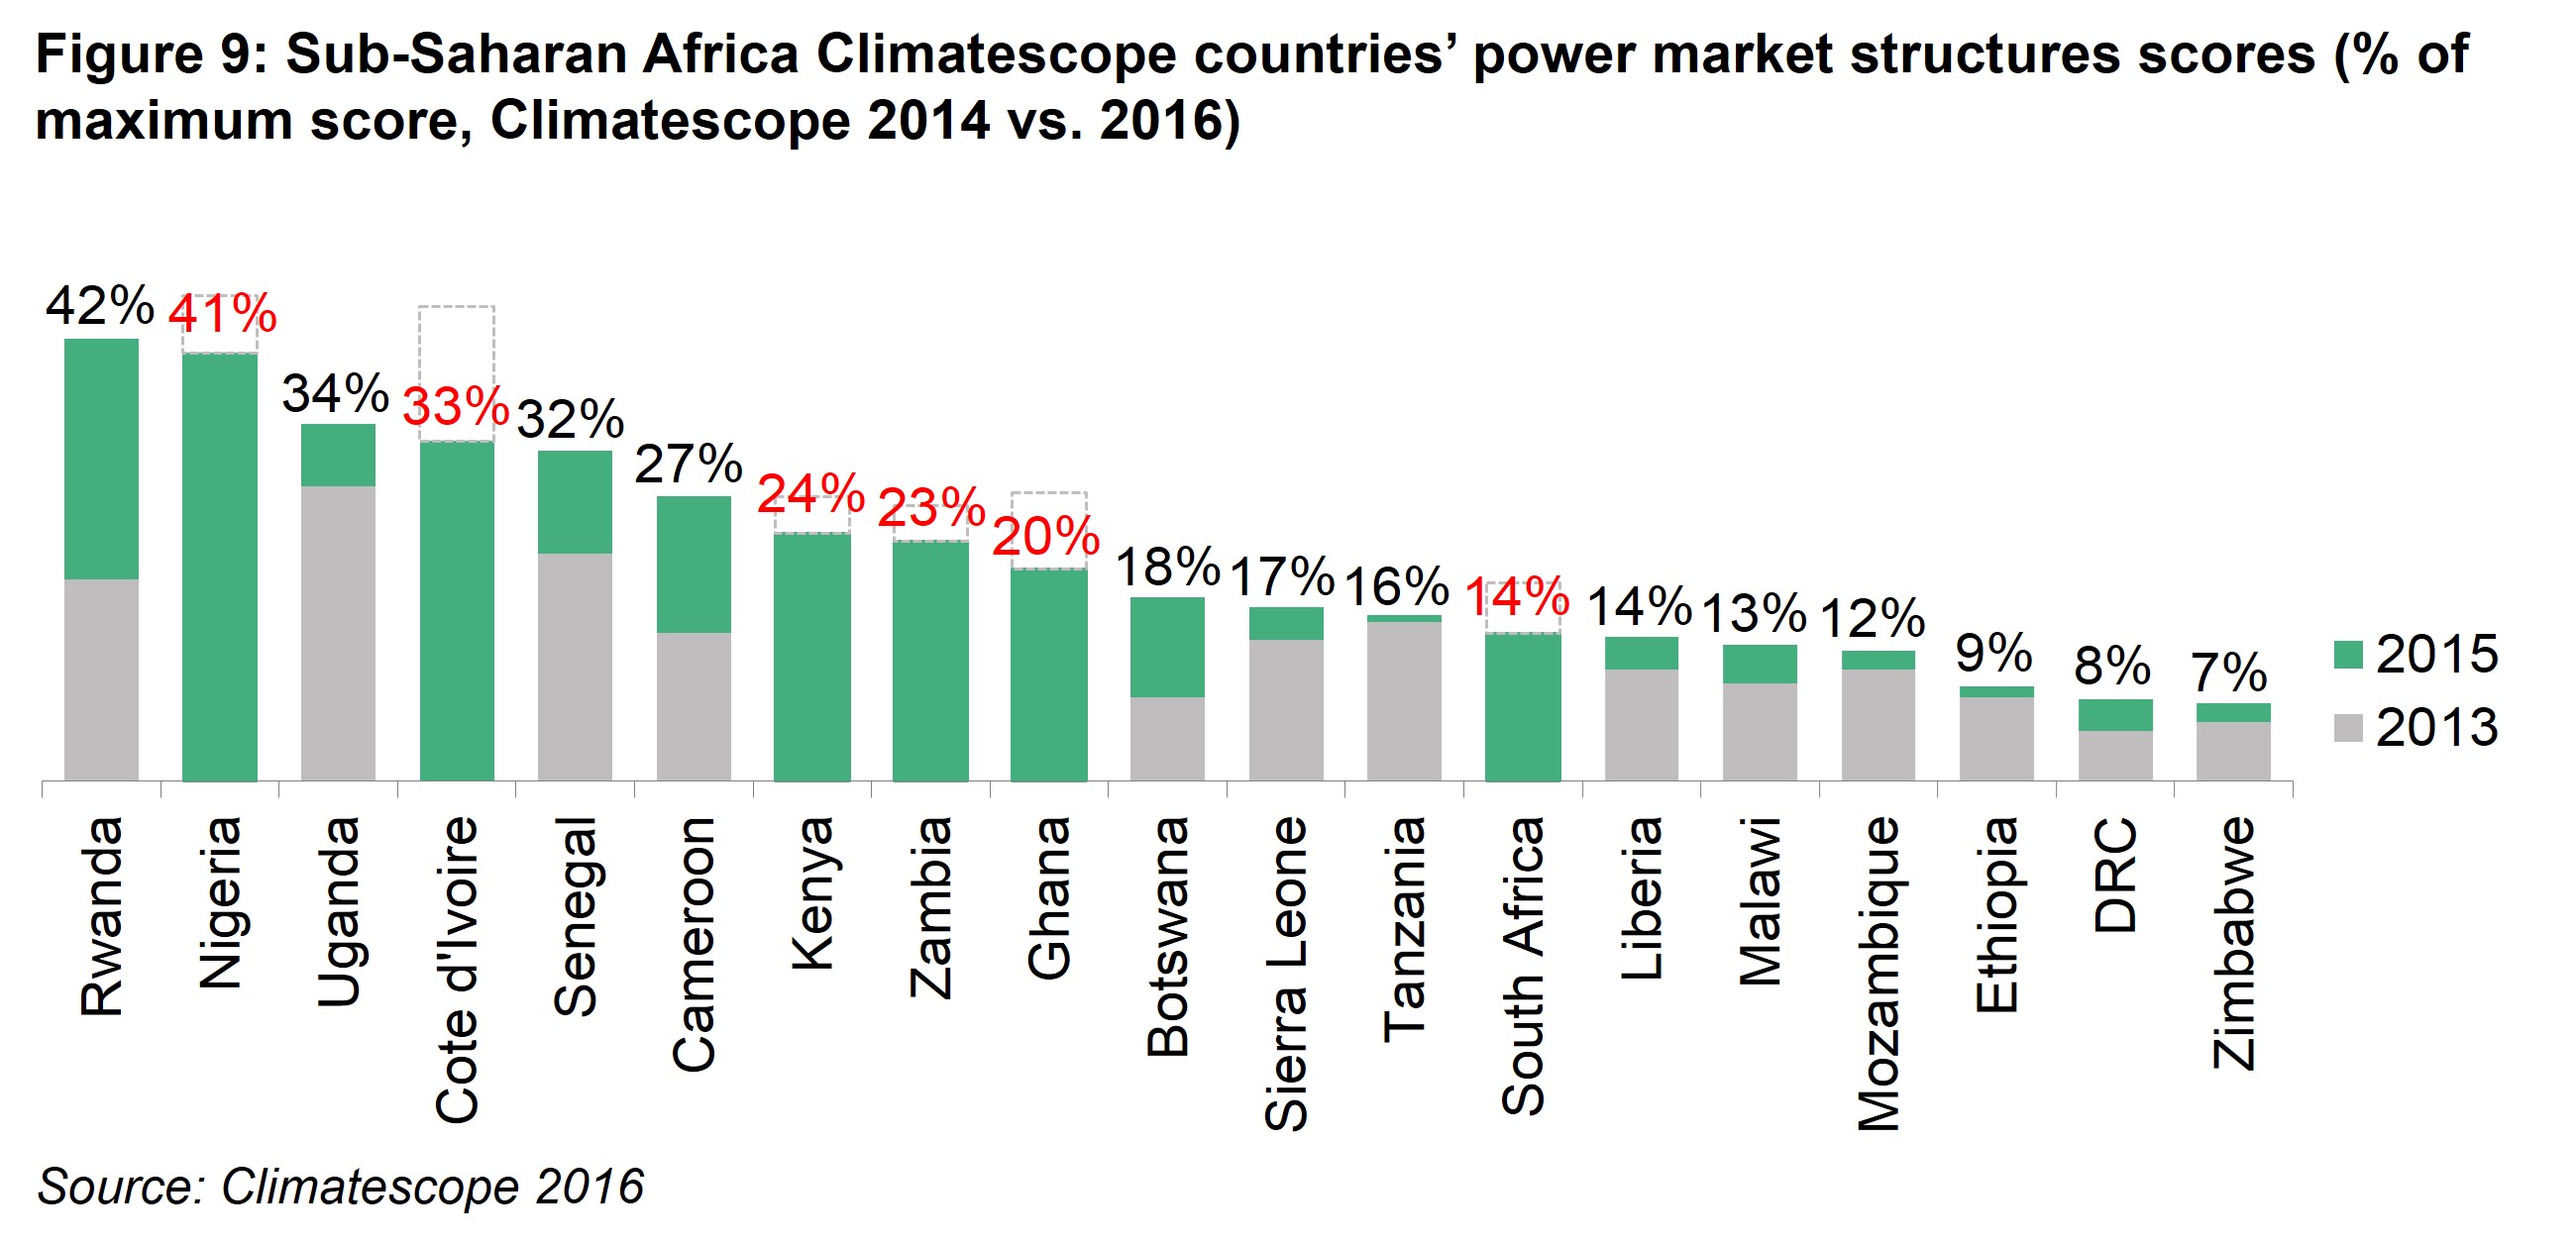
Scores on this indicator demonstrate the progress achieved by Sub-Saharan African countries in improving their power sector structures (Figure 9). Nigeria, Côte d’Ivoire and Ghana are the only countries that scored significantly lower on this assessment between 2013 and 2015.
The financial situation of off-takers in Nigeria has prevented the growth of new generation capacity both from renewable and fossil fuel sources. The government has introduced the Nigerian Bulk Electricity Trading organization to act as a viable off-taker in an attempt to address this.
In Côte d’Ivoire the generation sector has been opened to private sector participation but little has been done to support access to the market for renewables and the state remains heavily involved in the transmission system operator. Similar dynamics have affected Ghana’s power sector, where developers have found it difficult to negotiate new PPAs with the government. However, the rising frequency of power outages in Côte d’Ivoire has also helped create a new incentive for solar PV and storage solutions in the residential and commercial sectors.
Liberalization is focused on the generation market with transmission and distribution almost always in the hand of either a single national utility, or several utilities each with monopolies over specific geographic areas. The role of independent power producers (IPPs) remained relatively stable between 2013 and 2015, averaging 23% of generation across the region. However, the near doubling of IPP generation market share in Tanzania and South Africa over this period, from 26% to 47% and 3% to 6% respectively, shows how rapidly the situation can evolve.
Structural challenges such as offtake risk, abuse of influence by incumbent utilities and political or currency risk continue to limit the growth of IPPs and renewables in the region. However, a number of countries have taken measures to address these challenges, and the average score on the off-take risk indicator for sub-Saharan African nations in the survey has risen from 0.38 in 2014 (against a maximum 2.0 score) to 0.61 in this latest update.
The Nigerian government has created Nigeria Bulk Electricity Trading to act as a single offtaker for all IPPs, as the poor financial health and management of the country’s distribution company has caused payment delays. Uganda received support from the International Finance Corporation and World Bank to award two 50MW solar PV project contracts that protect developers from political and currency risk and give access to concessional financing. Senegal and Tanzania are expected to follow suit. Finally, the South African treasury has agreed to assume responsibility for all payments to renewable energy project developers under the country’s IPP program in cases where state-owned utility ESKOM cannot. Climatescope scores countries based on the risk posed to project developers by local off-takers, or buyers of their power.
OFF-GRID RENEWABLES ARE MAKING INROADS
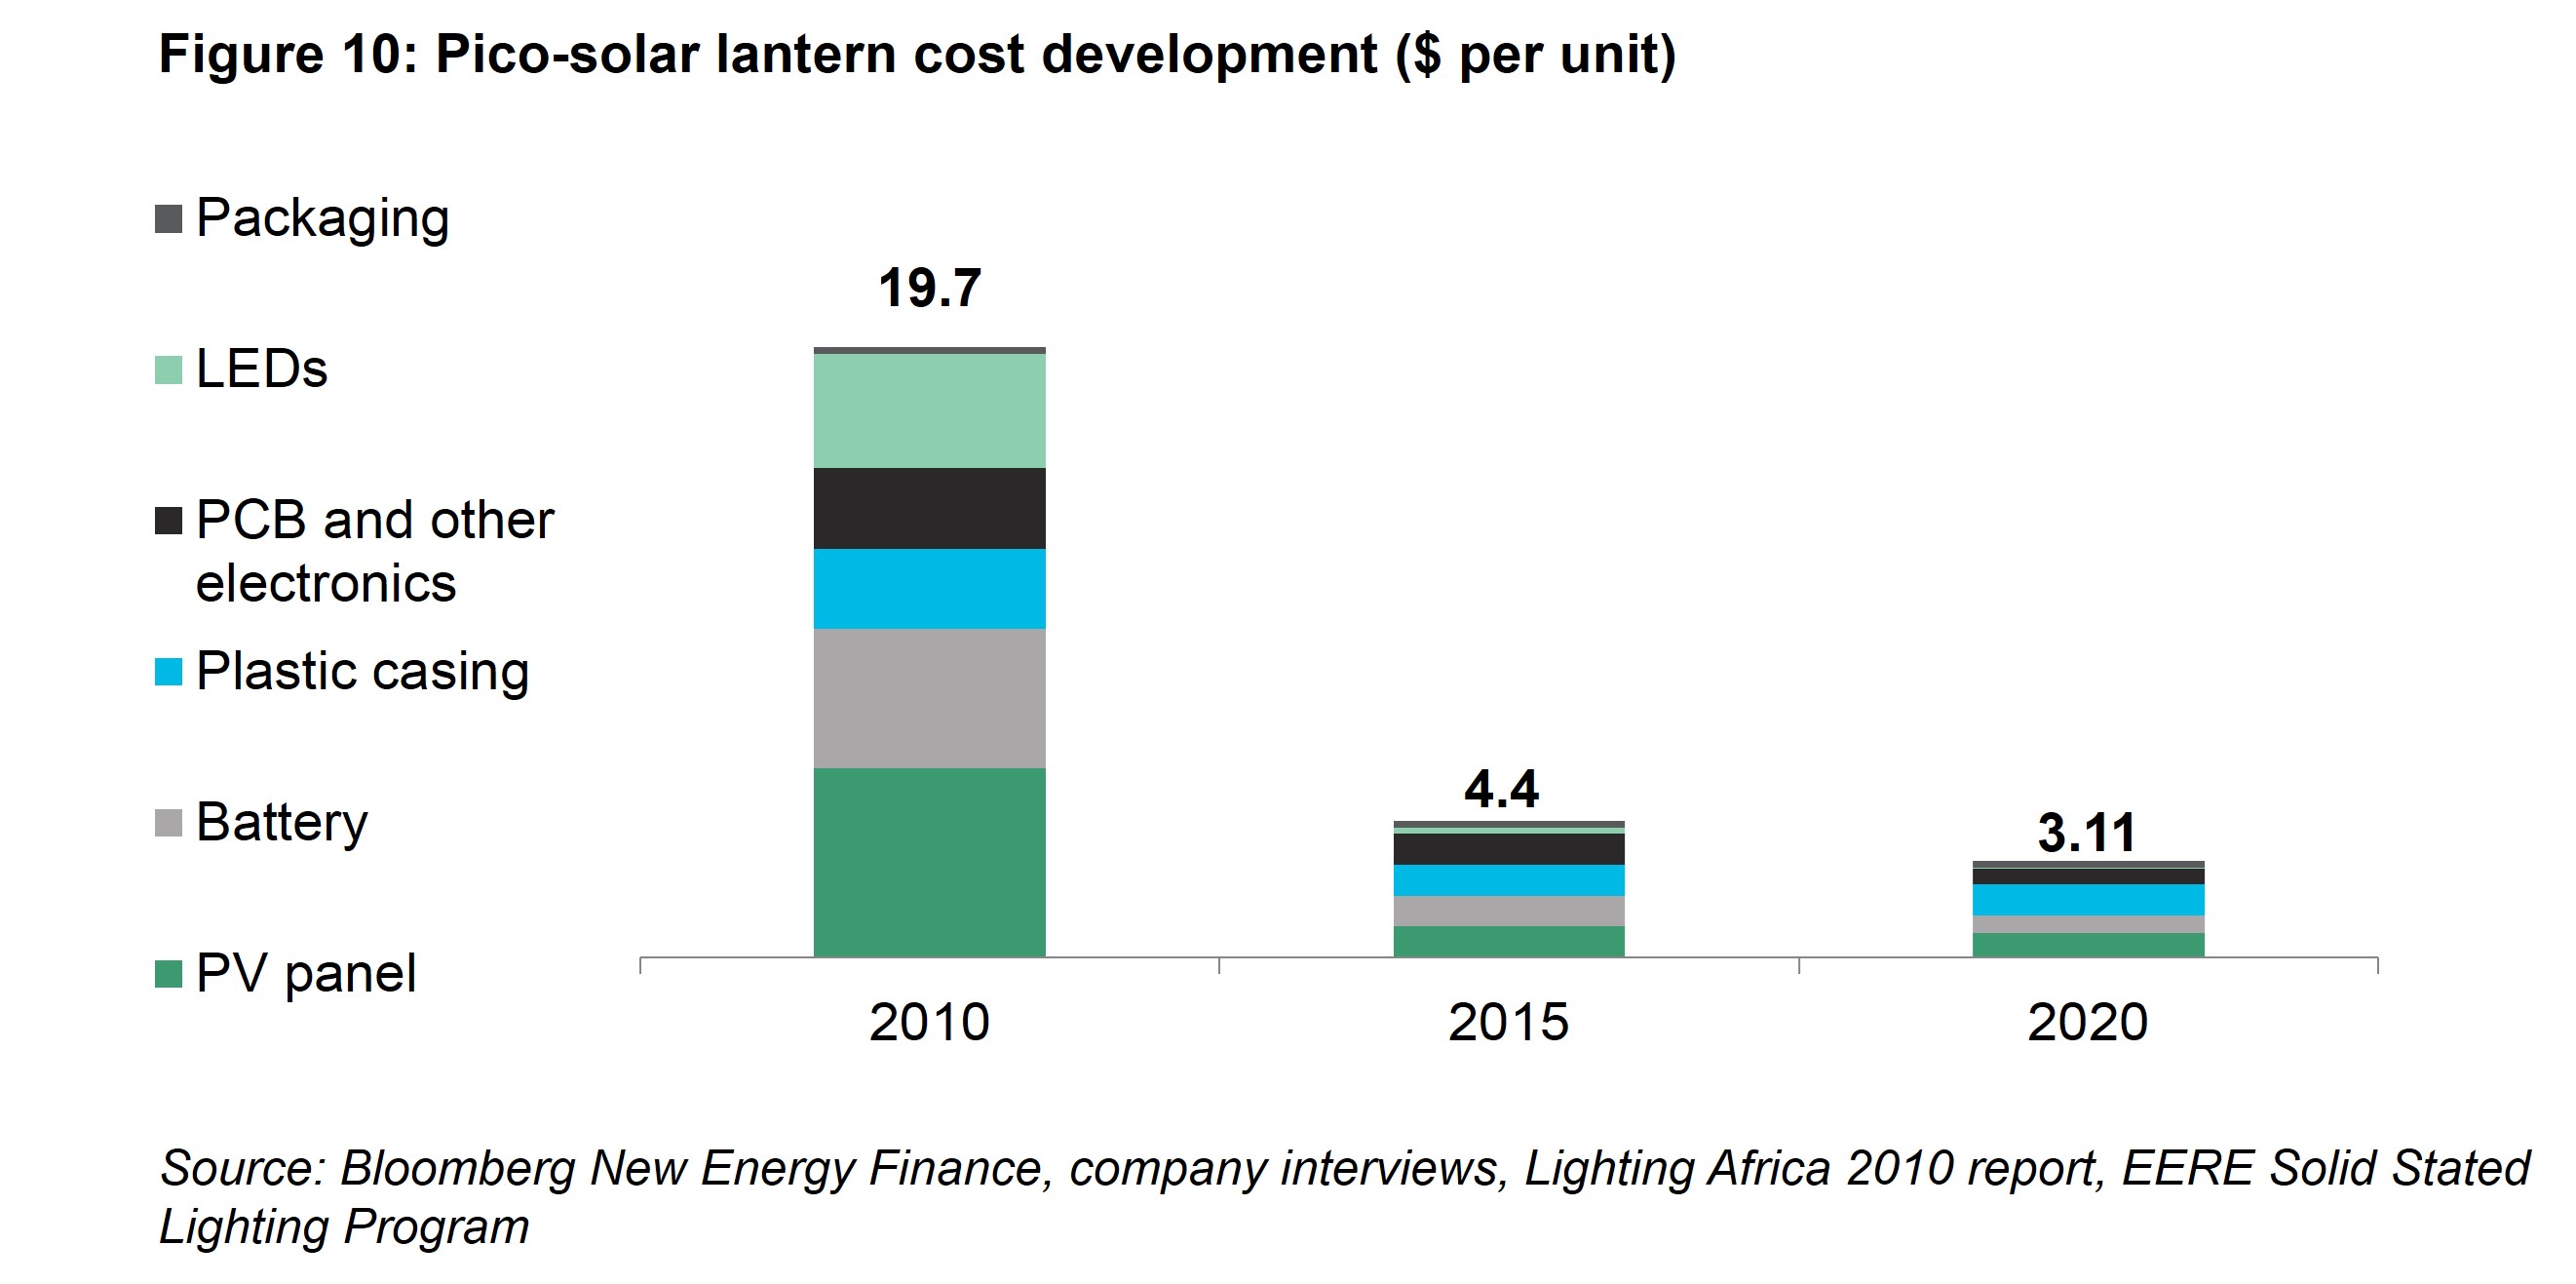
Exceptional cost reductions for different components used in off-grid electrification solutions are starting to transform the power sector in Sub-Saharan Africa (Figure 10).
Just under 11m households in the region were using pico-PV systems to electrify their homes as of June 2015, typically with solutions sufficient to power a couple of lights and charge mobile phones, according to BNEF research (Figure 11). However, it is also clear that the penetration of off-grid solutions is quite uneven across the continent.
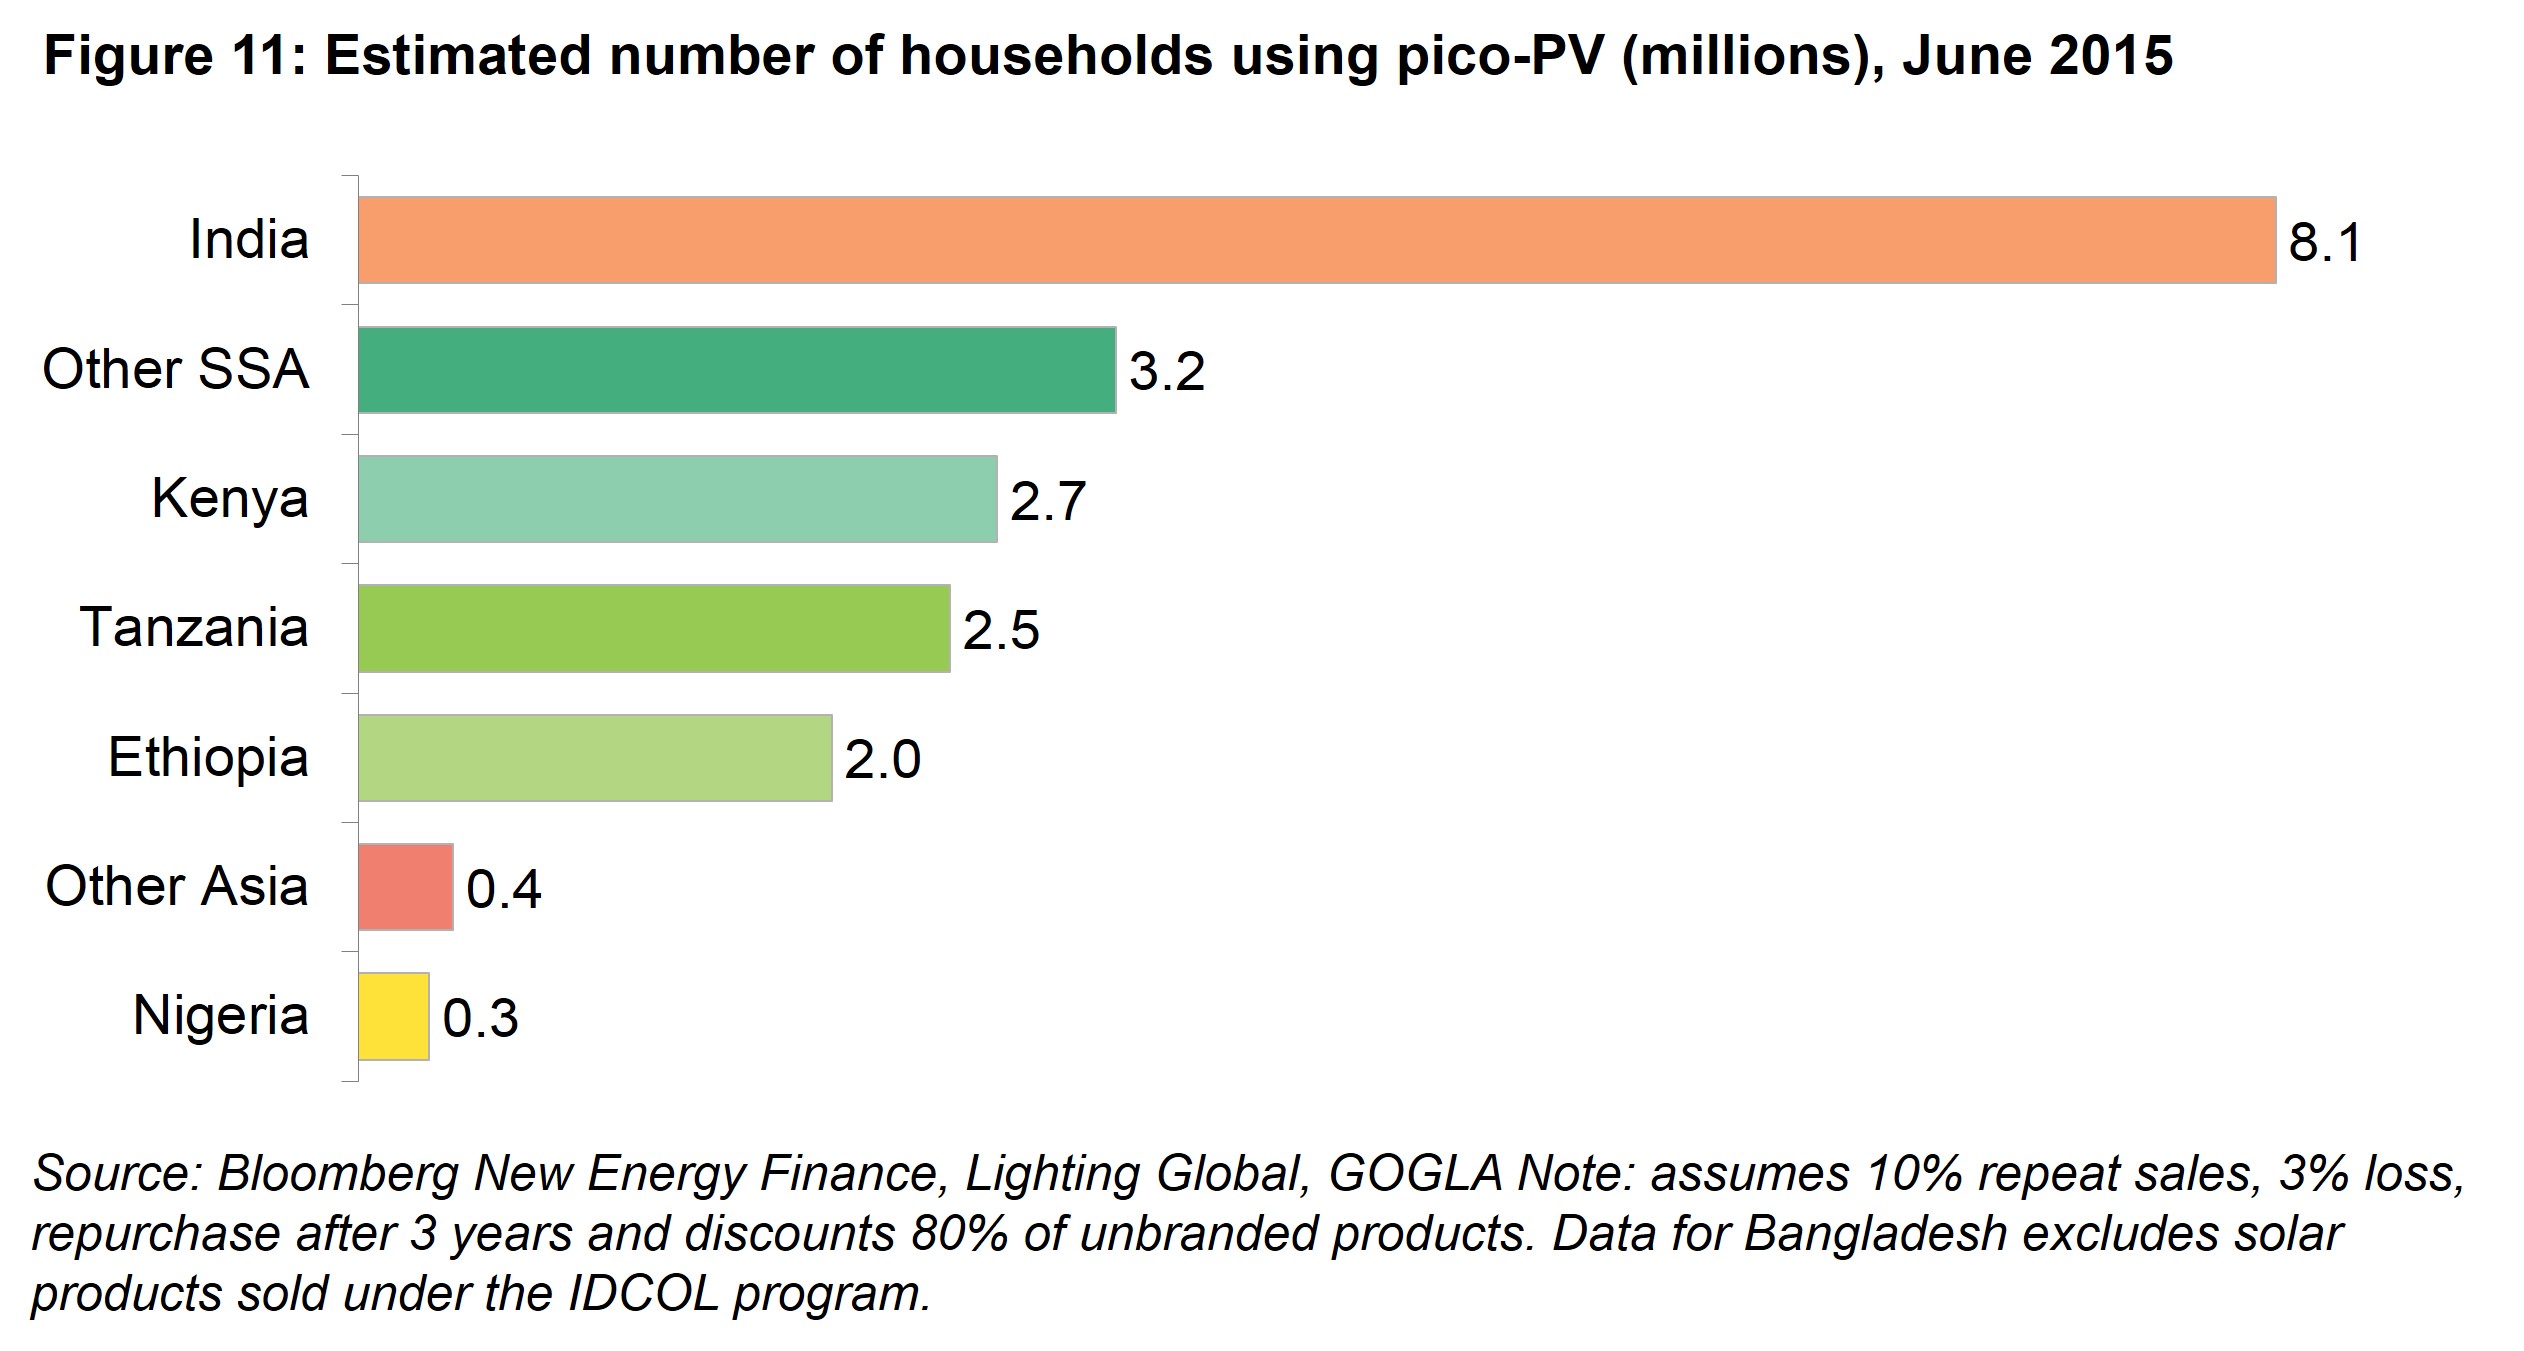
East African nations have seen the highest uptake of off-grid technology, and this includes the Sub-Saharan markets reviewed in Climatescope. This was achieved due in large part to a positive enabling environment combining high mobile phone and mobile money penetration with harmonized taxation schemes favoring renewable energy off-grid technologies applied across all members of the East Africa economic community.
The region is home to some of the world’s most successful pay-as-you-go (PAYG) solar companies, and they have attracted a growing interest from venture capital (VC) investors. Off-grid solar companies located in the sub-Saharan Africa markets reviewed in Climatescope attracted around $115m of VC investments since 2012, $90m of which was invested in East African countries, primarily into PAYG activities.
Globally, Bloomberg New Energy Finance tracked $551m of investment in the off-grid renewables sector, excluding minigrids, as of the first quarter of 2016.
The potential for off-grid electrification solutions is also increasingly being recognised by the governments of the region. All 19 Sub-Saharan Climatescope countries have stated targets for improving electrification rates. Among them, 13 have explicitly detailed plans to incorporate off-grid solutions to achieve their goals (Figure 12).
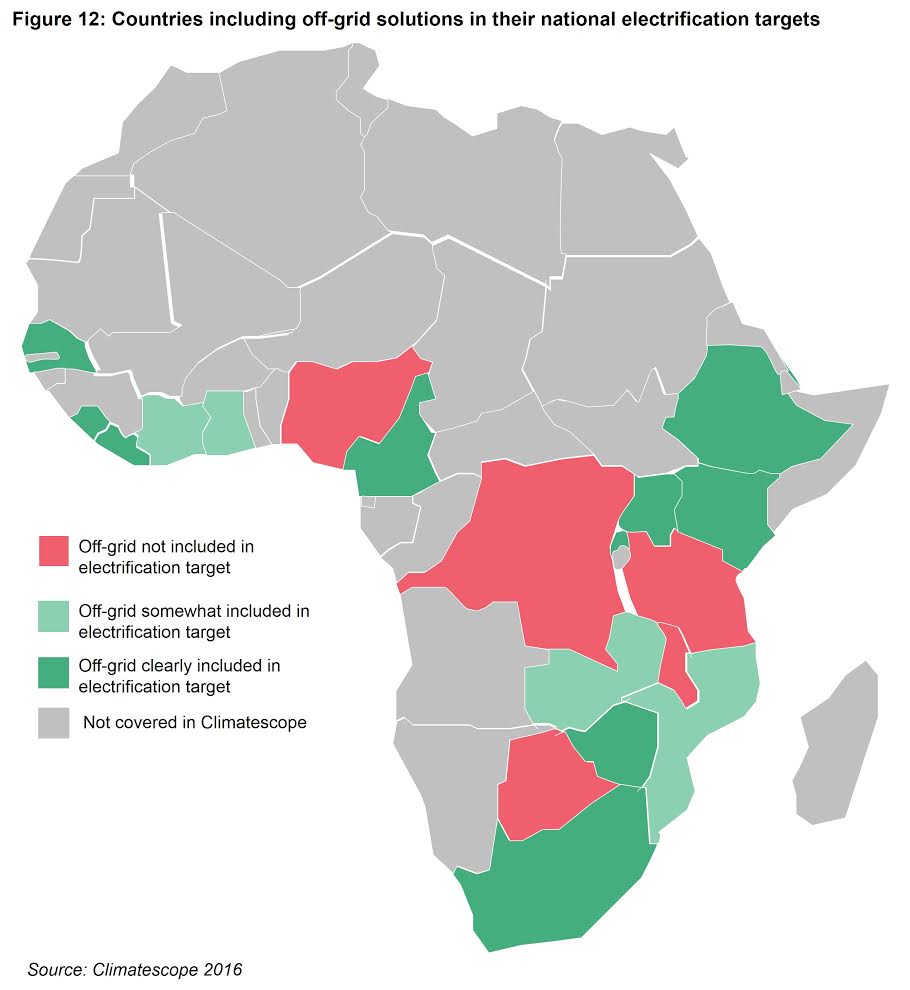
The effective level of government support for off-grid solutions still varies greatly across the continent. Rwanda has fully recognized the cost saving potential and application of different off-grid technologies and has established targets for pico-solar system distributions, mini-grids and grid extensions with similarly ambitious budget targets for each. This a marked move away from electrification plans in the region in the past, which have tended to focus heavily on grid extensions.
Côte d’Ivoire on the other hand, has earmarked just under 5% of its rural electrification budget for isolated systems and the government has made clear that a stronger emphasis will be put on the subsidization of grid extensions and new consumer connections. Coming years will be critical in deciding what contribution off-grid energy solutions will make toward electrification of Sub-Saharan African markets as governments and donor agencies have made access to electricity a top priority.
In many cases, the use of renewables in mini-grids or stand-alone systems offers a cost-effective way to provide consumers access to the energy services they need most, lighting and the charging of low-power devices such as mobile phones. Ensuring that electrification plans are drafted with full recognition of the costs and technological profiles of different solutions will be essential toward ensuring that access scales as quickly – and cost effectively – as possible.
Starting in 2017, the Global Climatescope website will be enriched with quarterly market updates on trends in the off-grid industry.
Average scores
- %% region.name %%
- %% region.score[0].mean | round:2 %%
| Regional rank | Global rank | Country | Global score | Trend | Topics: 0.0 - 5.0 | Grid |
|---|---|---|---|---|---|---|
| %% country.score[0].regional_ranking | leadingZero:2 %% | %% country.score[0].overall_ranking | leadingZero:2 %% | %% country.name %% States | %% country.score[0].value | thousands:2 %% |
|
%% country.grid %% |