Enabling framework
Topic
PARAMETER I – ENABLING FRAMEWORK
Climatescope’s Enabling Framework Parameter I includes a total of 22 indicators, which assess a country’s policy and power sector structure, levels of clean energy penetration, levels of price attractiveness for clean energy deployment, and the expectations for how large the market for clean energy can become. Parameter I took into account a wide variety of indicators to compile a final score. This ranged from the macro in the form of overall policy scores for a country’s clean energy policy regime, to the micro in the form of kerosene or diesel prices for lesser developed nations. Parameter I contributed 40% toward each nation’s overall score. For more on how this parameter and others were compiled, please see the complete Climatescope methodology.
KEY FINDINGS
Climatescope 2016 tracked notable improvements in the enabling framework conditions of the majority of countries reviewed. No less than 46 of the 55 countries reviewed in Climatescopes 2015 and 2016 saw their Parameter I scores rise year-over-year. By comparison, in the 2015 survey, only 26 countries showed improvements from the prior year.
Not only did the number of countries that saw progress rise, but the average level of improvement also jumped. The average per-country gain on Parameter 1 from 2015-2016 was twice as high as from 2014-2015 and, for that matter, from 2013-2014.
The two specific areas where countries demonstrated progress were on strengthened clean energy policy frameworks and power sector structures. Climatescope tracked 28 countries that enhanced laws or regulations to better support renewables. The survey also counted 15 countries that achieved progress in liberalizing the power market, often through the unbundling of state-run utilities. This year’s Climatescope analysed for the first time three nations in the Middle East and North Africa region – Jordan, Egypt, and Lebanon. The three achieved mixed results. Jordan made it to the top 4 on the enabling framework paramater with a score of 2.31 and ranked 11th overall. For their part, Egypt and Lebanon scored 1.03 and 0.87, reflecting challenging socio-economic and security conditions in those nations in recent years.
AN IMPROVING POLICY LANDSCAPE
Clean energy-friendly policies are becoming ever more common in Climatescope nations. The number of countries in the survey with no such policies on the books fell to just four in 20161, down from six in 2015 and eight in 2014. The types and sophistication of policies countries are adopting have also evolved over the past three years (Figure 1).
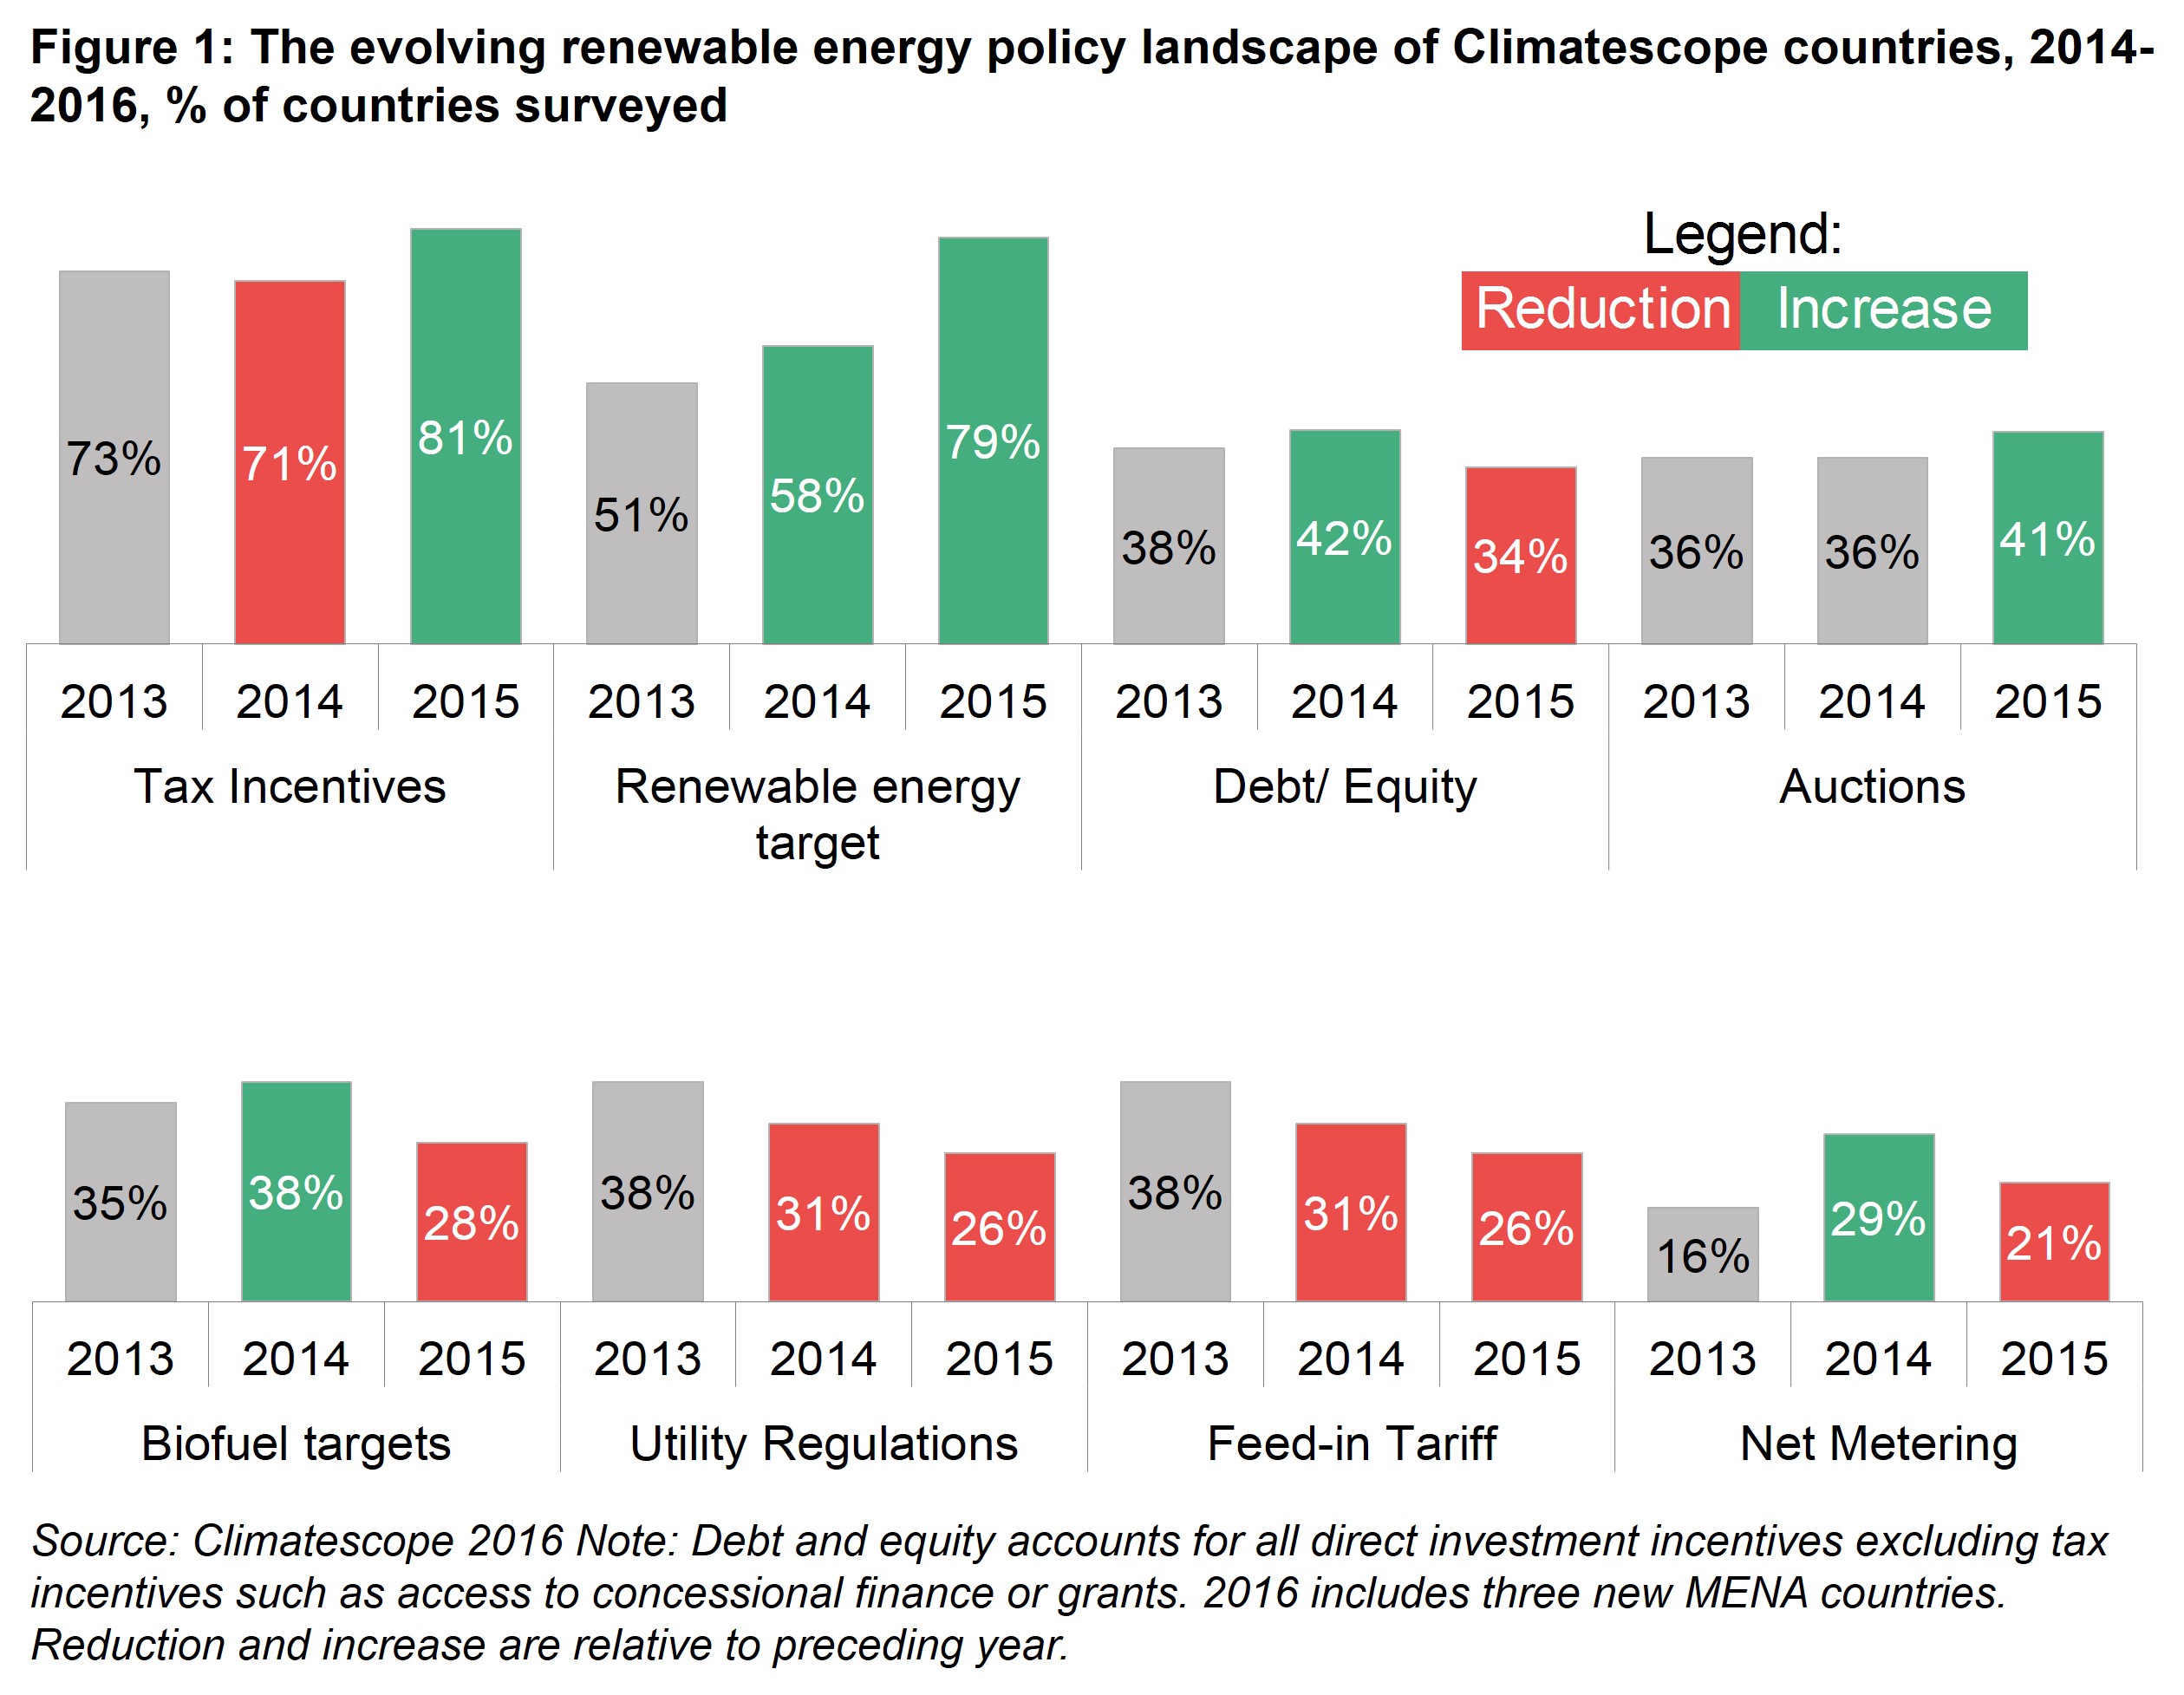
Four in five Climatescope countries (79%) have now established renewable energy targets compared to half of nations in 2014. A similar number of countries have tax incentives in place to help achieve these goals.
Climatescope 2016 highlights a shift away from feed-in tariffs in developing countries toward reverse auctions in their place. The former allow project owners to sell clean power at a market premium, while the latter invite developers to bid to sell their power at least cost.
The reputation of feed-in tariffs has suffered in recent years in the wake of the European experience. In some EU countries, generously priced feed-in tariffs prompted unexpectedly large and sudden booms in renewable build. This, in turn, resulted in ballooning public subsidy liabilities and put considerable pressure on electricity bills or government budgets.
Climatescope nations tend to be more cash-constrained and the relative development of public finance management may limit capacity to forecast public expenditure that responds to demand. Furthermore, most Climatescope nations lack liberalised wholesale markets and are home to state-owned utilities. All of these conditions make tenders more appealing.
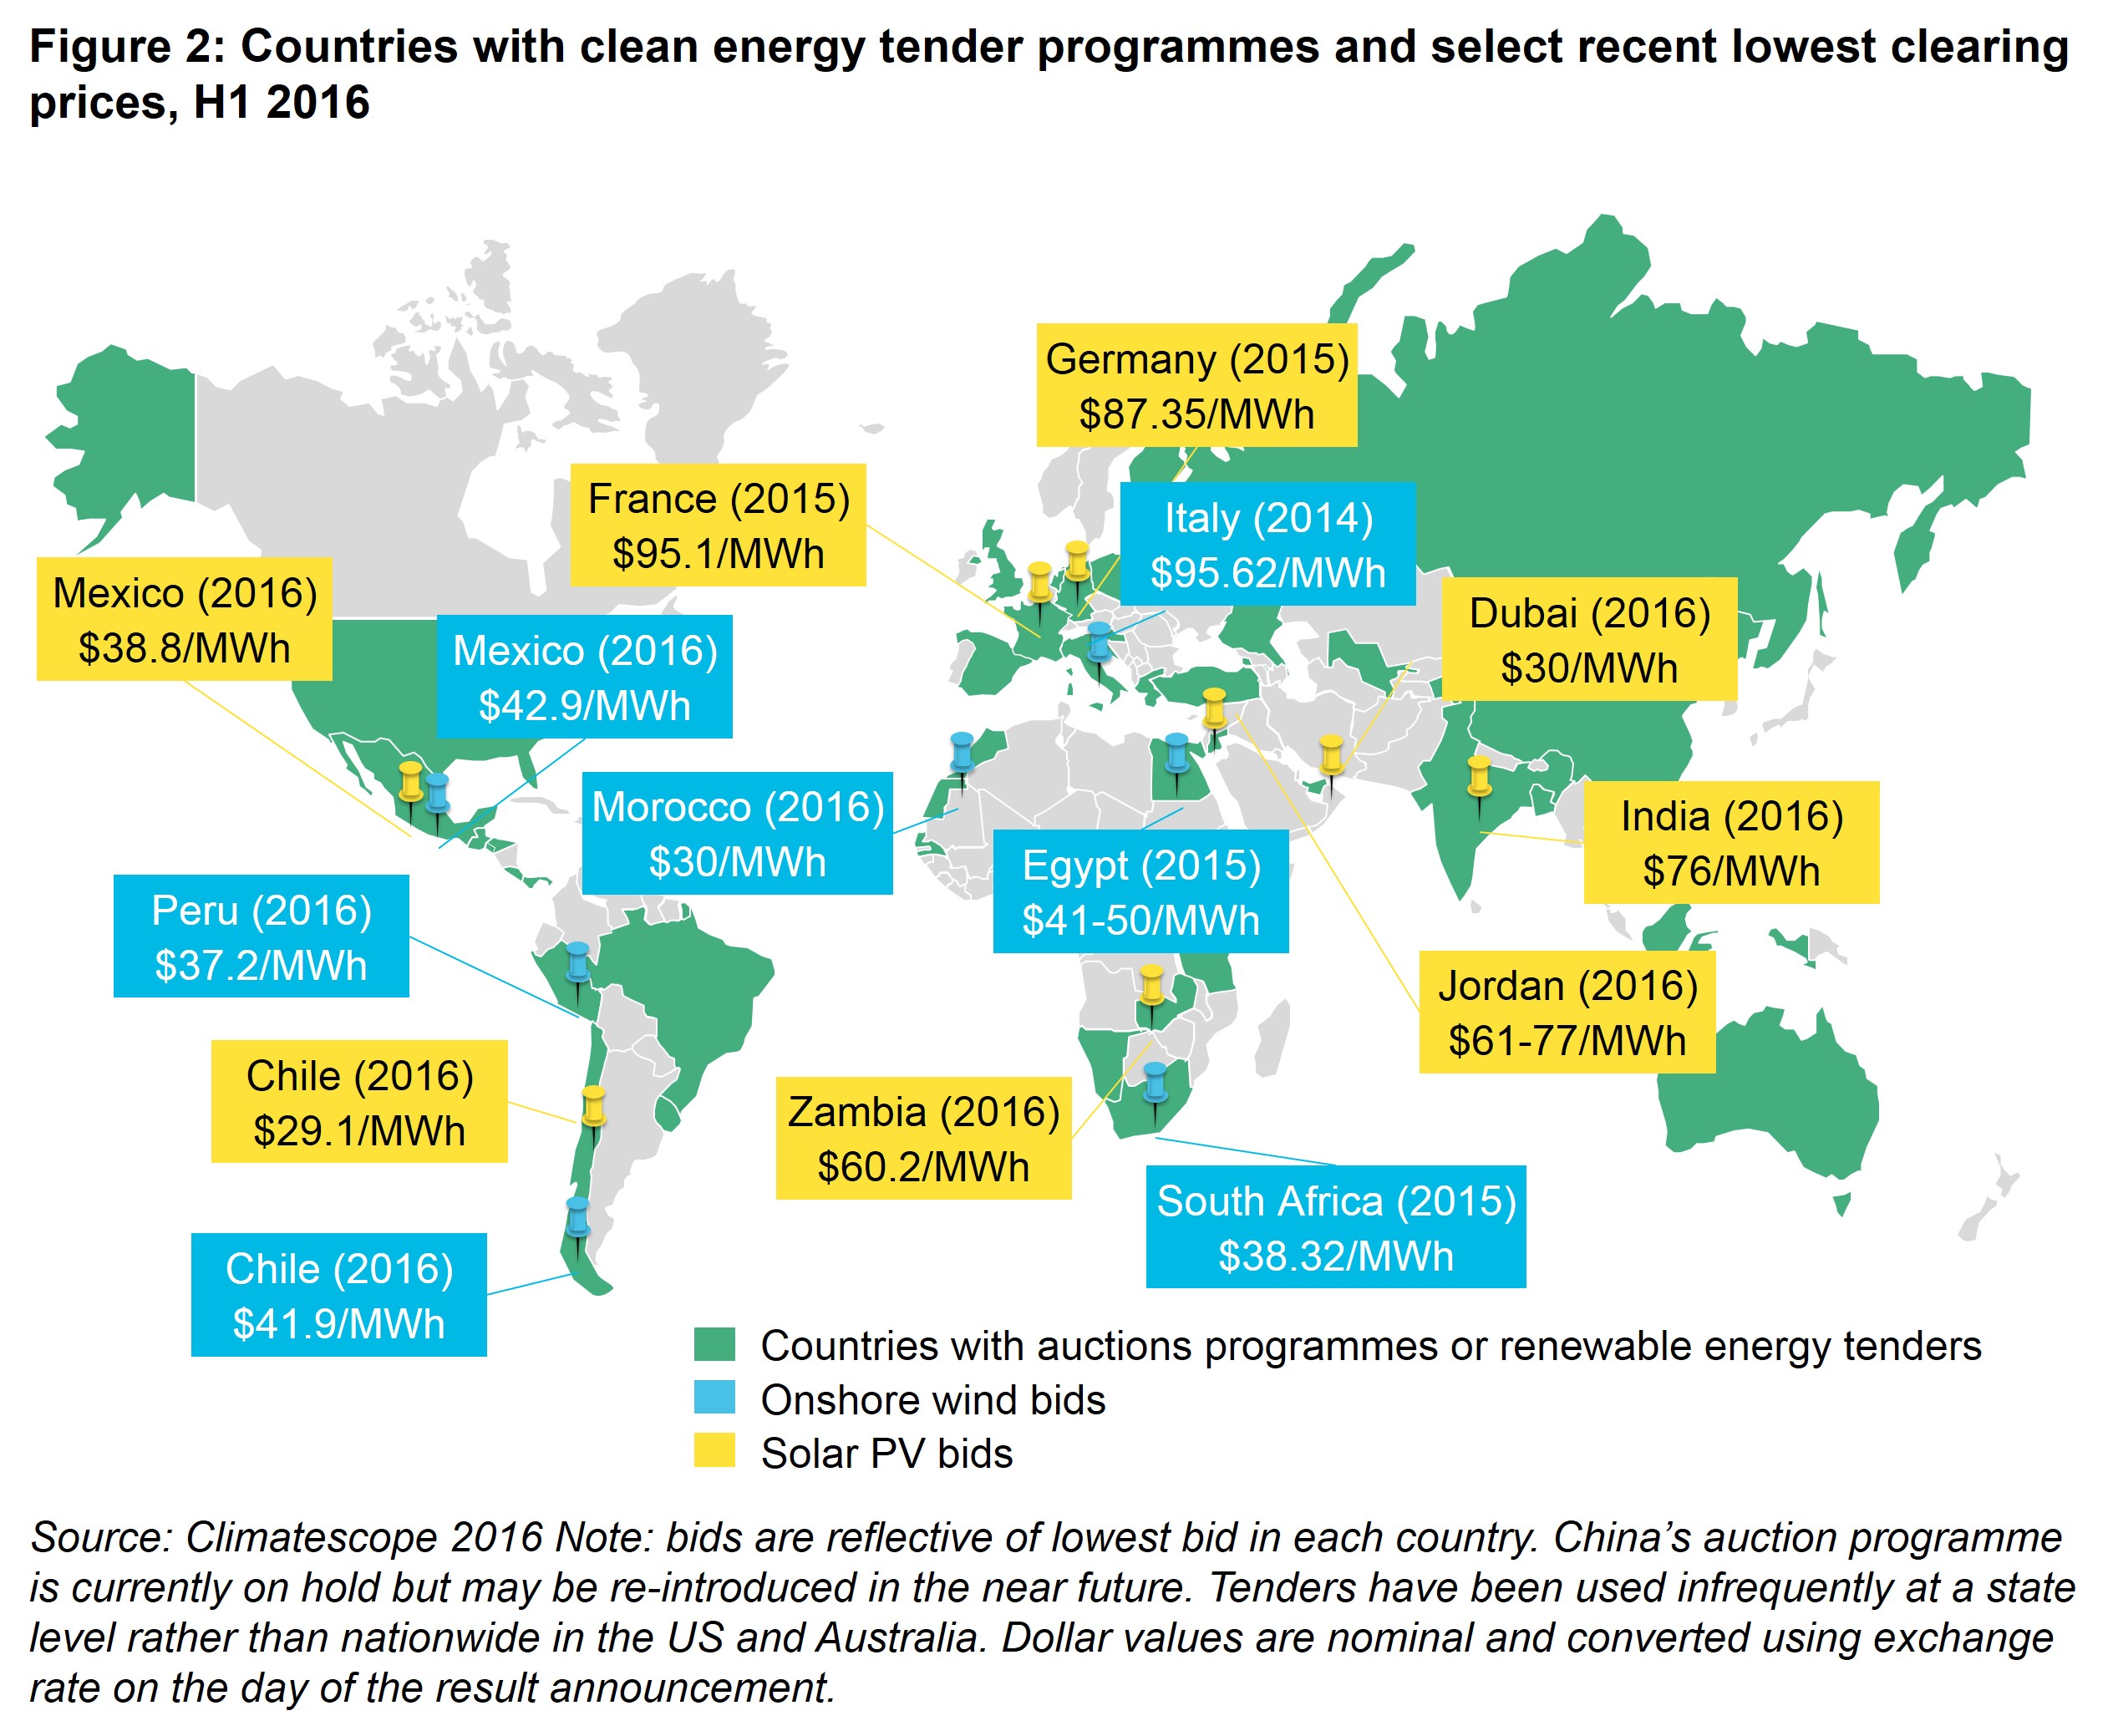
As the introduction of renewable energy targets has become more commonplace, so has the use of tenders and auctions targeting renewable energy specifically (Figure 1). This trend started in Brazil, spread across most of Latin America, and to Sub-Saharan Africa and Asia, where India is home to the largest photovoltaic auction programme in the world. We expect this trend to continue as governments seek to emulate the successes of their peers in securing extremely competitively priced renewable energy through auction programmes (Figure 2).
Not all the policy trends are moving in a positive direction, however. Climatescope found that just a quarter of nations reviewed have utility regulations that favour the development and integration of renewables. Examples of such regulations include mandating purchases of renewable generation and explicit renewable portfolio standards for utilities. Such rules will only grow in importance as more renewable generation is fed into the grid and must compete with and be balanced against other sources. The recent curtailment and payment delays associated with renewables projects in China and India highlight the challenge of rapidly integrating large amounts of clean power to the grid (see the Asia summary and country profiles for more details).
THE GROWING ROLE OF INDEPENDENT POWER PRODUCERS
The role of independent power producers (IPPs) in generation is growing around the world in line with the growth of distributed clean energy capacity. This is true in Climatescope countries as well. However, the pace of change differs across regions and a number of markets remain entirely closed to IPPs. Figure 3 shows the distribution of Climatescope countries by the share of total installed capacity owned by IPPs for each region. The higher columns stack to the right hand side of each chart, the more important the role of IPPs in the region.
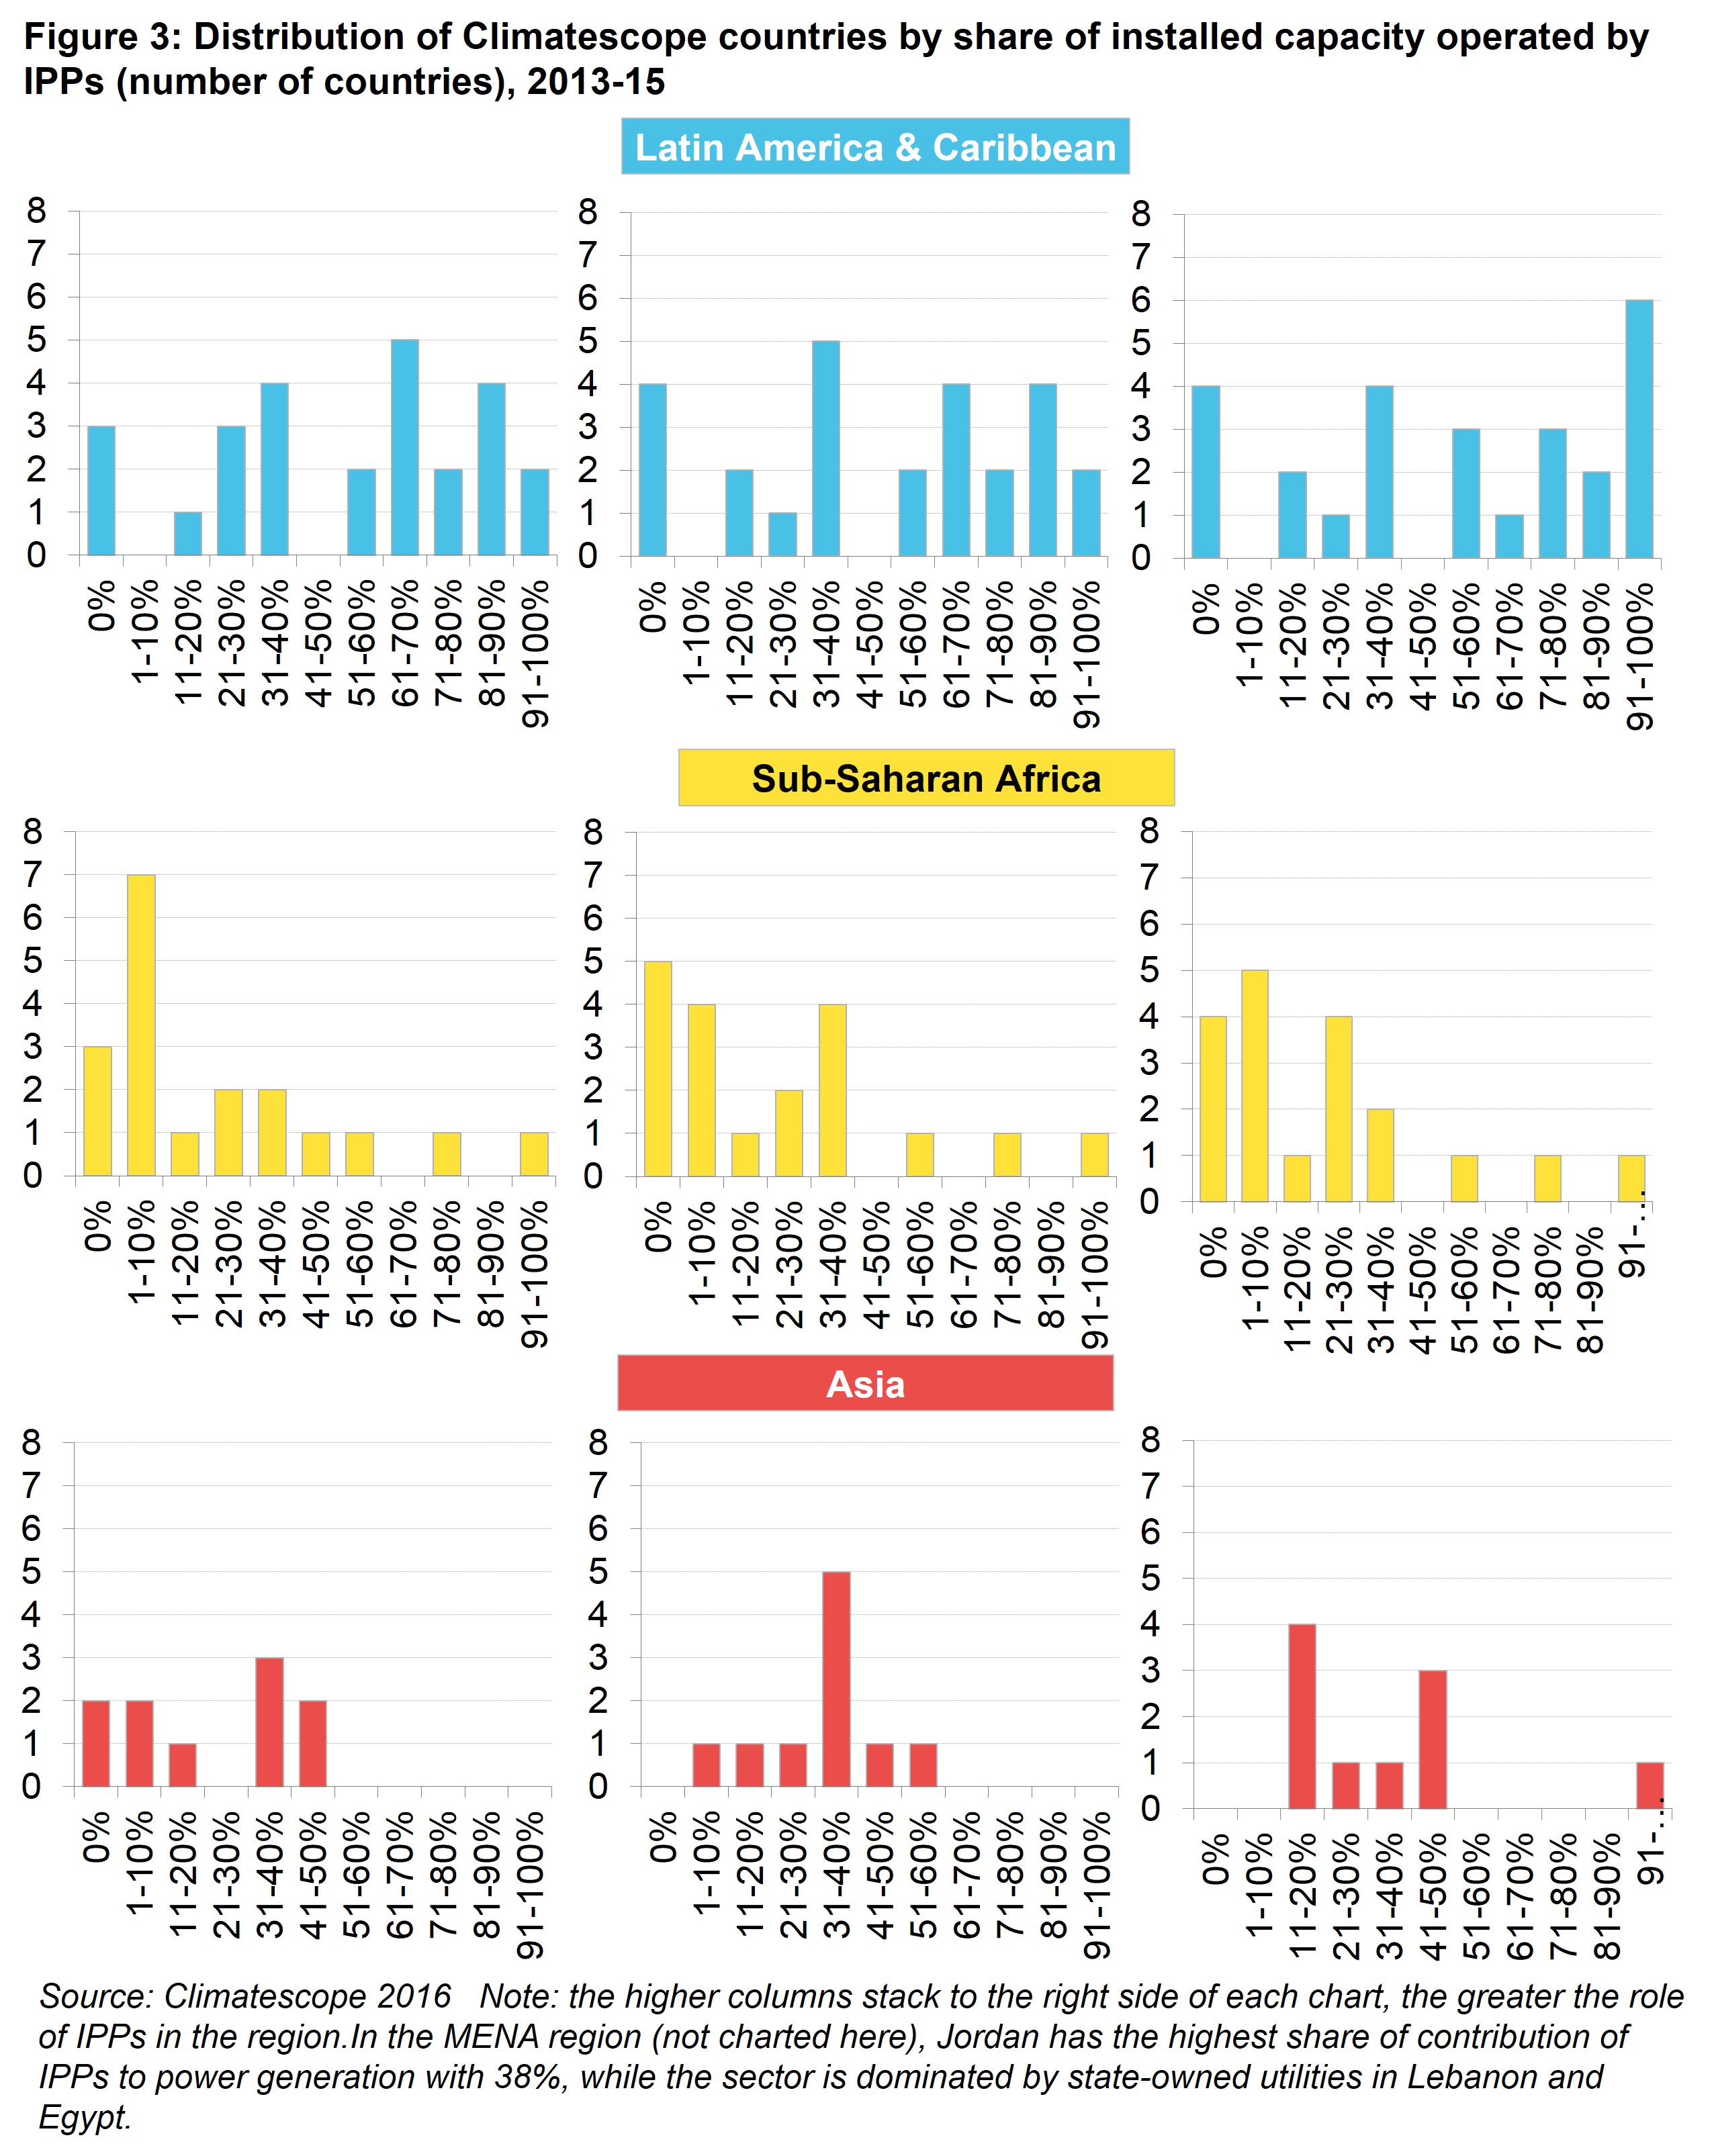
The market share of IPPs in Latin America and the Caribbean amounts to more than half of total generation capacity in 15 of 26 countries, far exceeding other regions. This is largely due to the fact that the use of auctions as a means to spur competition and procure least-cost generation is common in the region, including for fossil fuel capacity. Venezuela, Paraguay, Barbados and the Bahamas are the only countries where IPPs do not contribute to generation at all.
The role of IPPs is less clear in Sub-Saharan Africa. Nigeria and Cote d’Ivoire procure all and two thirds of their electricity from IPPs, respectively. Cote d’Ivoire has by far the longest experience with a liberalised generation market in the region and Nigeria has recently completed the liberalisation of its market. The top three is rounded out by Uganda (58%). Tanzania is where IPP contributions have been growing the fastest, increasing from 26% of generation in 2013 to 47% in 2015. All other power markets in the region tend to be dominated by state-owned utilities. However, countries in the region, including Ghana, Rwanda, Senegal and Sierra Leone, are increasingly implementing power sector reforms to unbundle these monopolies.
In Asia, most of the largest countries have also seen the share of IPPs grow rapidly between Climatescope 2014 and 2016 as a consequence of power sector reform and new capacity procurement programmes such as India’s auctions. China has embarked on the most comprehensive power sector reform in its history in an attempt to improve efficiency and manage oversupply while making more room for distributed low-carbon sources. But it is in Pakistan and Bangladesh that the generation landscape is changing quickest, with the share of IPPs increasing from 3% and 1% respectively to around half of total generation in both countries over the past three years.
LOWER COMMODITY PRICES AND LOWER (BUT STILL HIGH) POWER PRICES
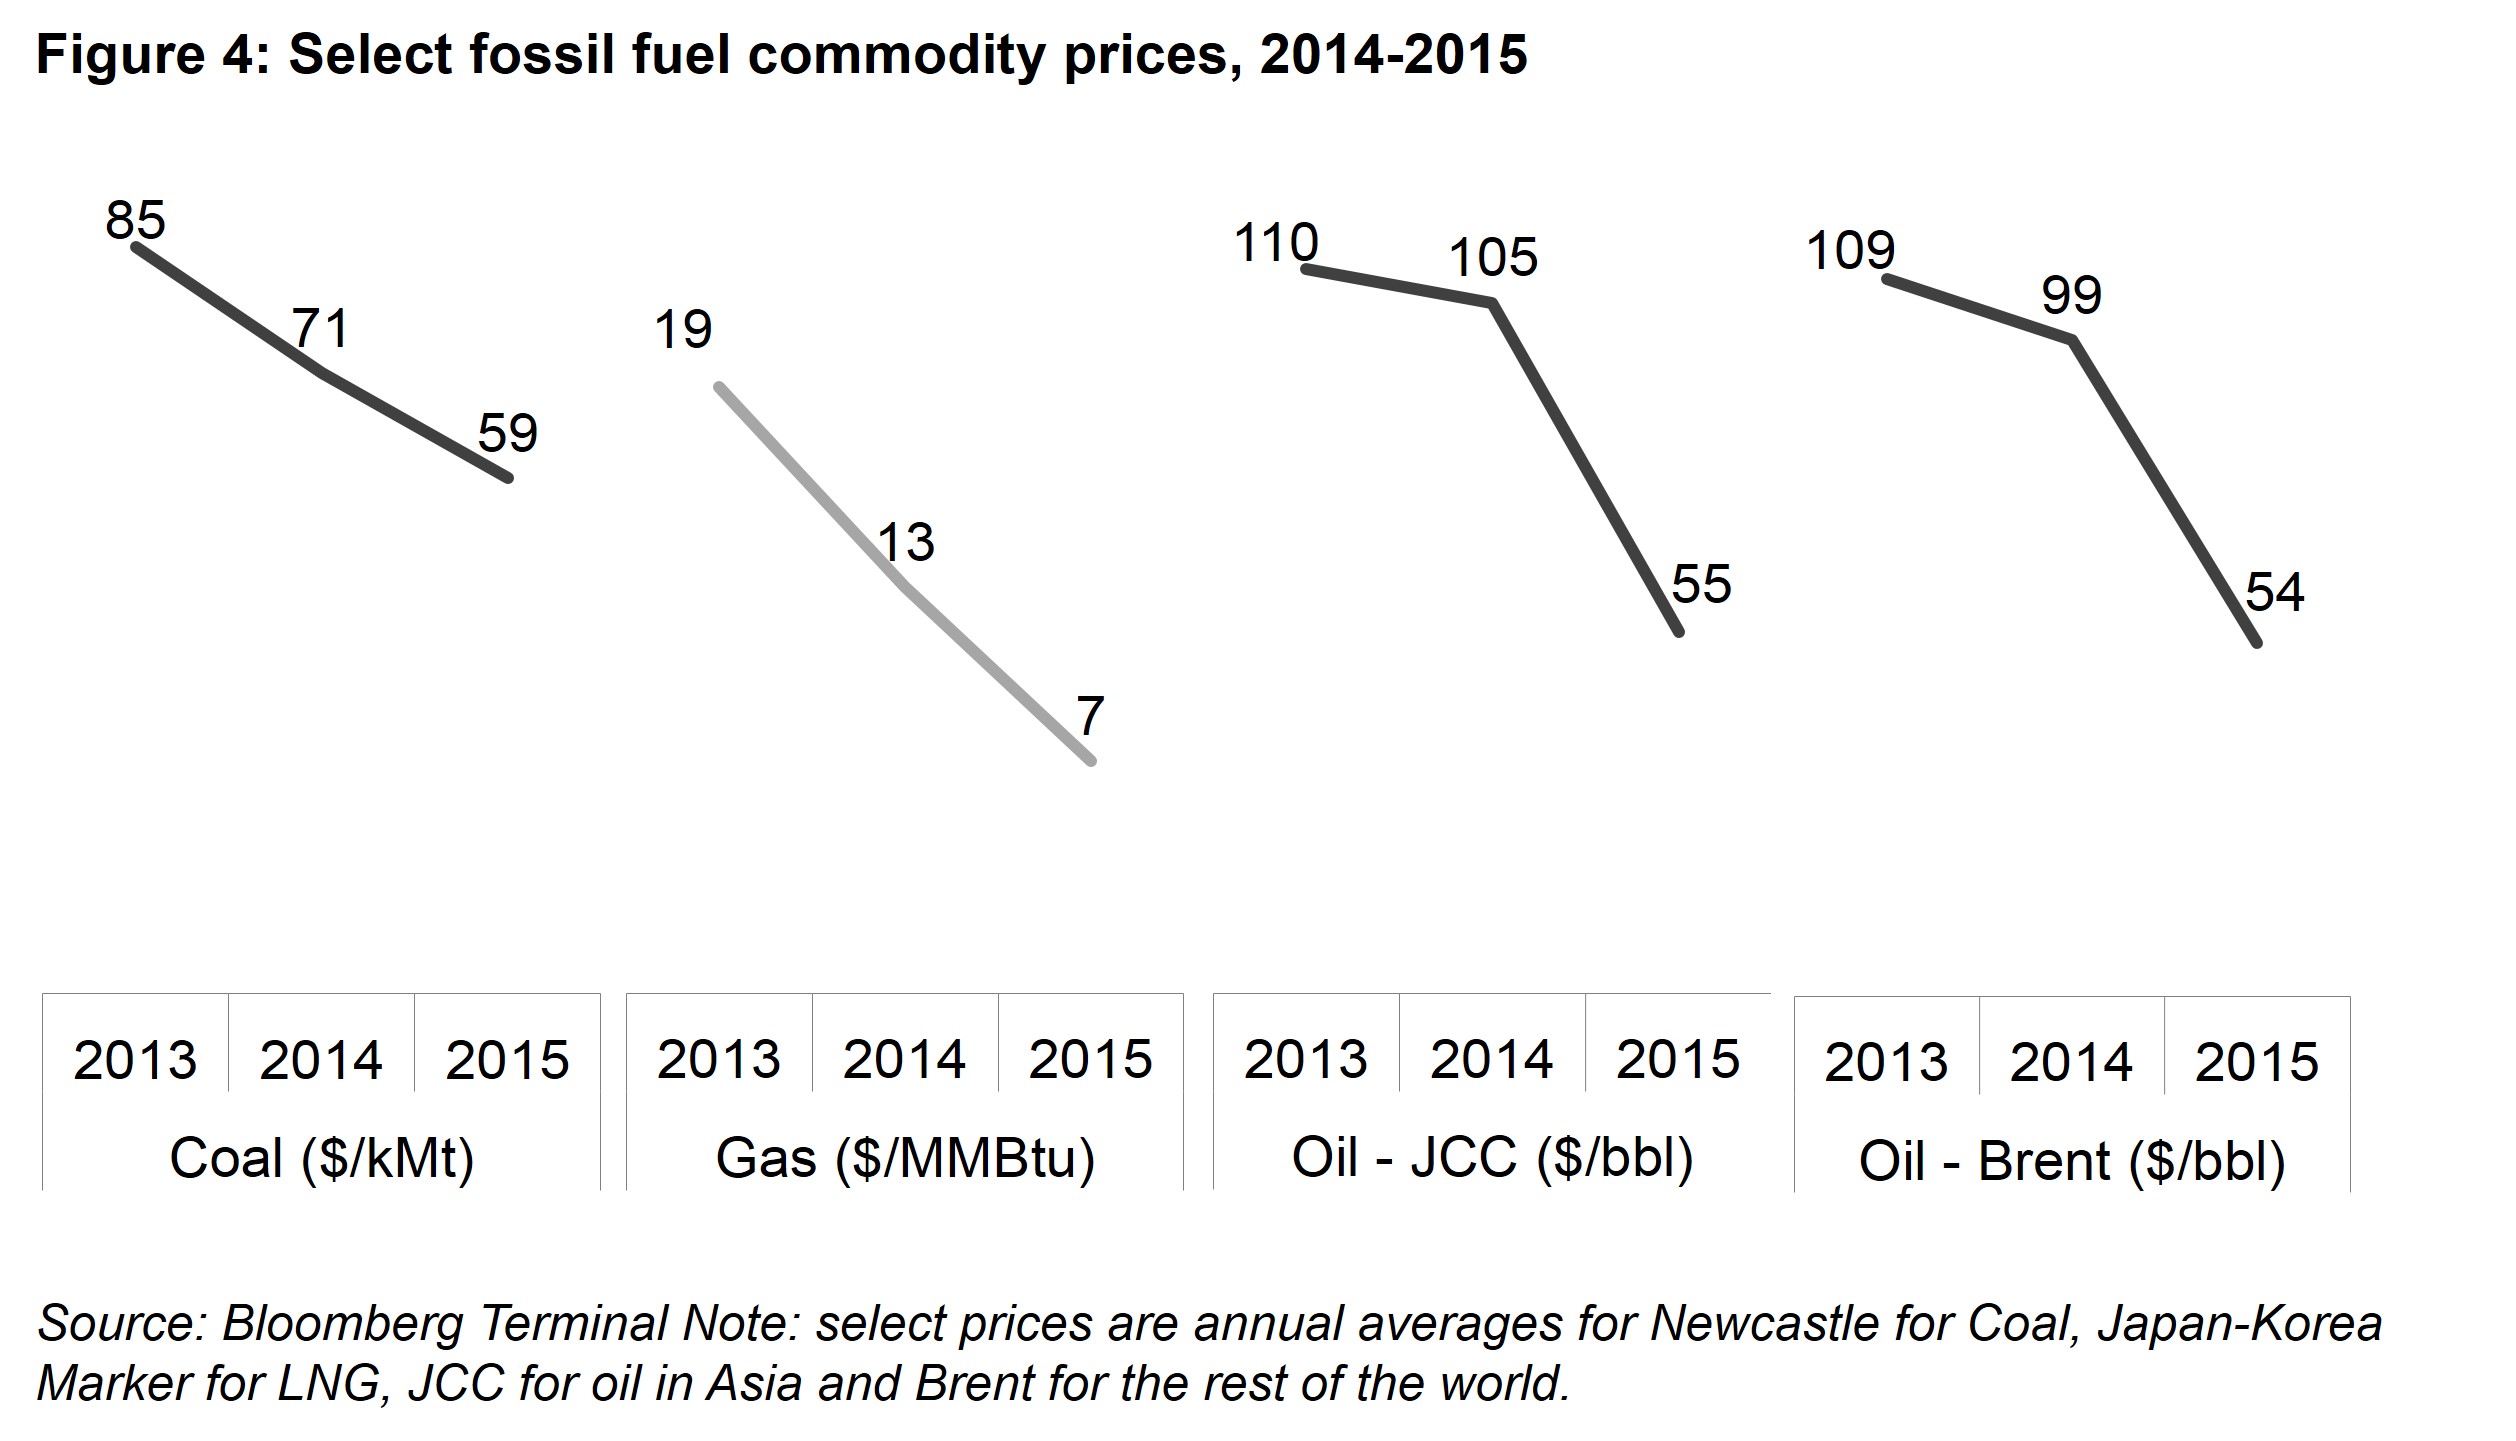
The emerging market nations surveyed for Climatescope have felt profoundly the effects of the global energy commodity price crash (Figure 4). Brazil, Colombia, Ecuador, India, Indonesia, Mexico, Nigeria and Venezuela are amongst the world’s top exporters of coal, gas and oil, and their economies have suffered. The International Monetary Fund (IMF) recently cut Nigeria’s 2016 GDP growth forecast from 2.3% to -1.8%, its lowest in 29 years. Venezuela’s GDP contracted 10% in 2015 and is expected to shrink by at least another 6% in 2016. Even the more diversified economy of Indonesia has seen export earnings and government revenues drop.
All of this could, in theory at least, put pressure on these governments to curtail their support for renewables. That said, aside from Indonesia (-0.11 on its overall Climatescope score), none of these commodity-rich nations saw their overall Climatescope scores drop in 2016. Climatescope 2017 will paint a clearer long-term picture of any adjustments made.
Conversely, lower commodity prices have provided much welcomed budgetary breathing room for Climatescope’s most commodity-import dependent countries. Lower fossil fuel prices have allowed governments and state-run utilities to pass some savings on to consumers in the form of lower retail power rates or to make up some of the accrued losses (Figure 5).
Historically, Climatescope countries with the highest retail power prices have correlated with those most reliant on oil for power generation. So it should come as little surprise that the majority of these nations saw some of the sharpest declines in retail power prices since Climatescope 2014. Amongst the countries that saw power prices decline (green in Figure 5), the average contribution of oil to total power generation was 35%. The 21 countries with the highest electricity prices and that saw a tariff reduction in 2015 generate half of their power from oil.
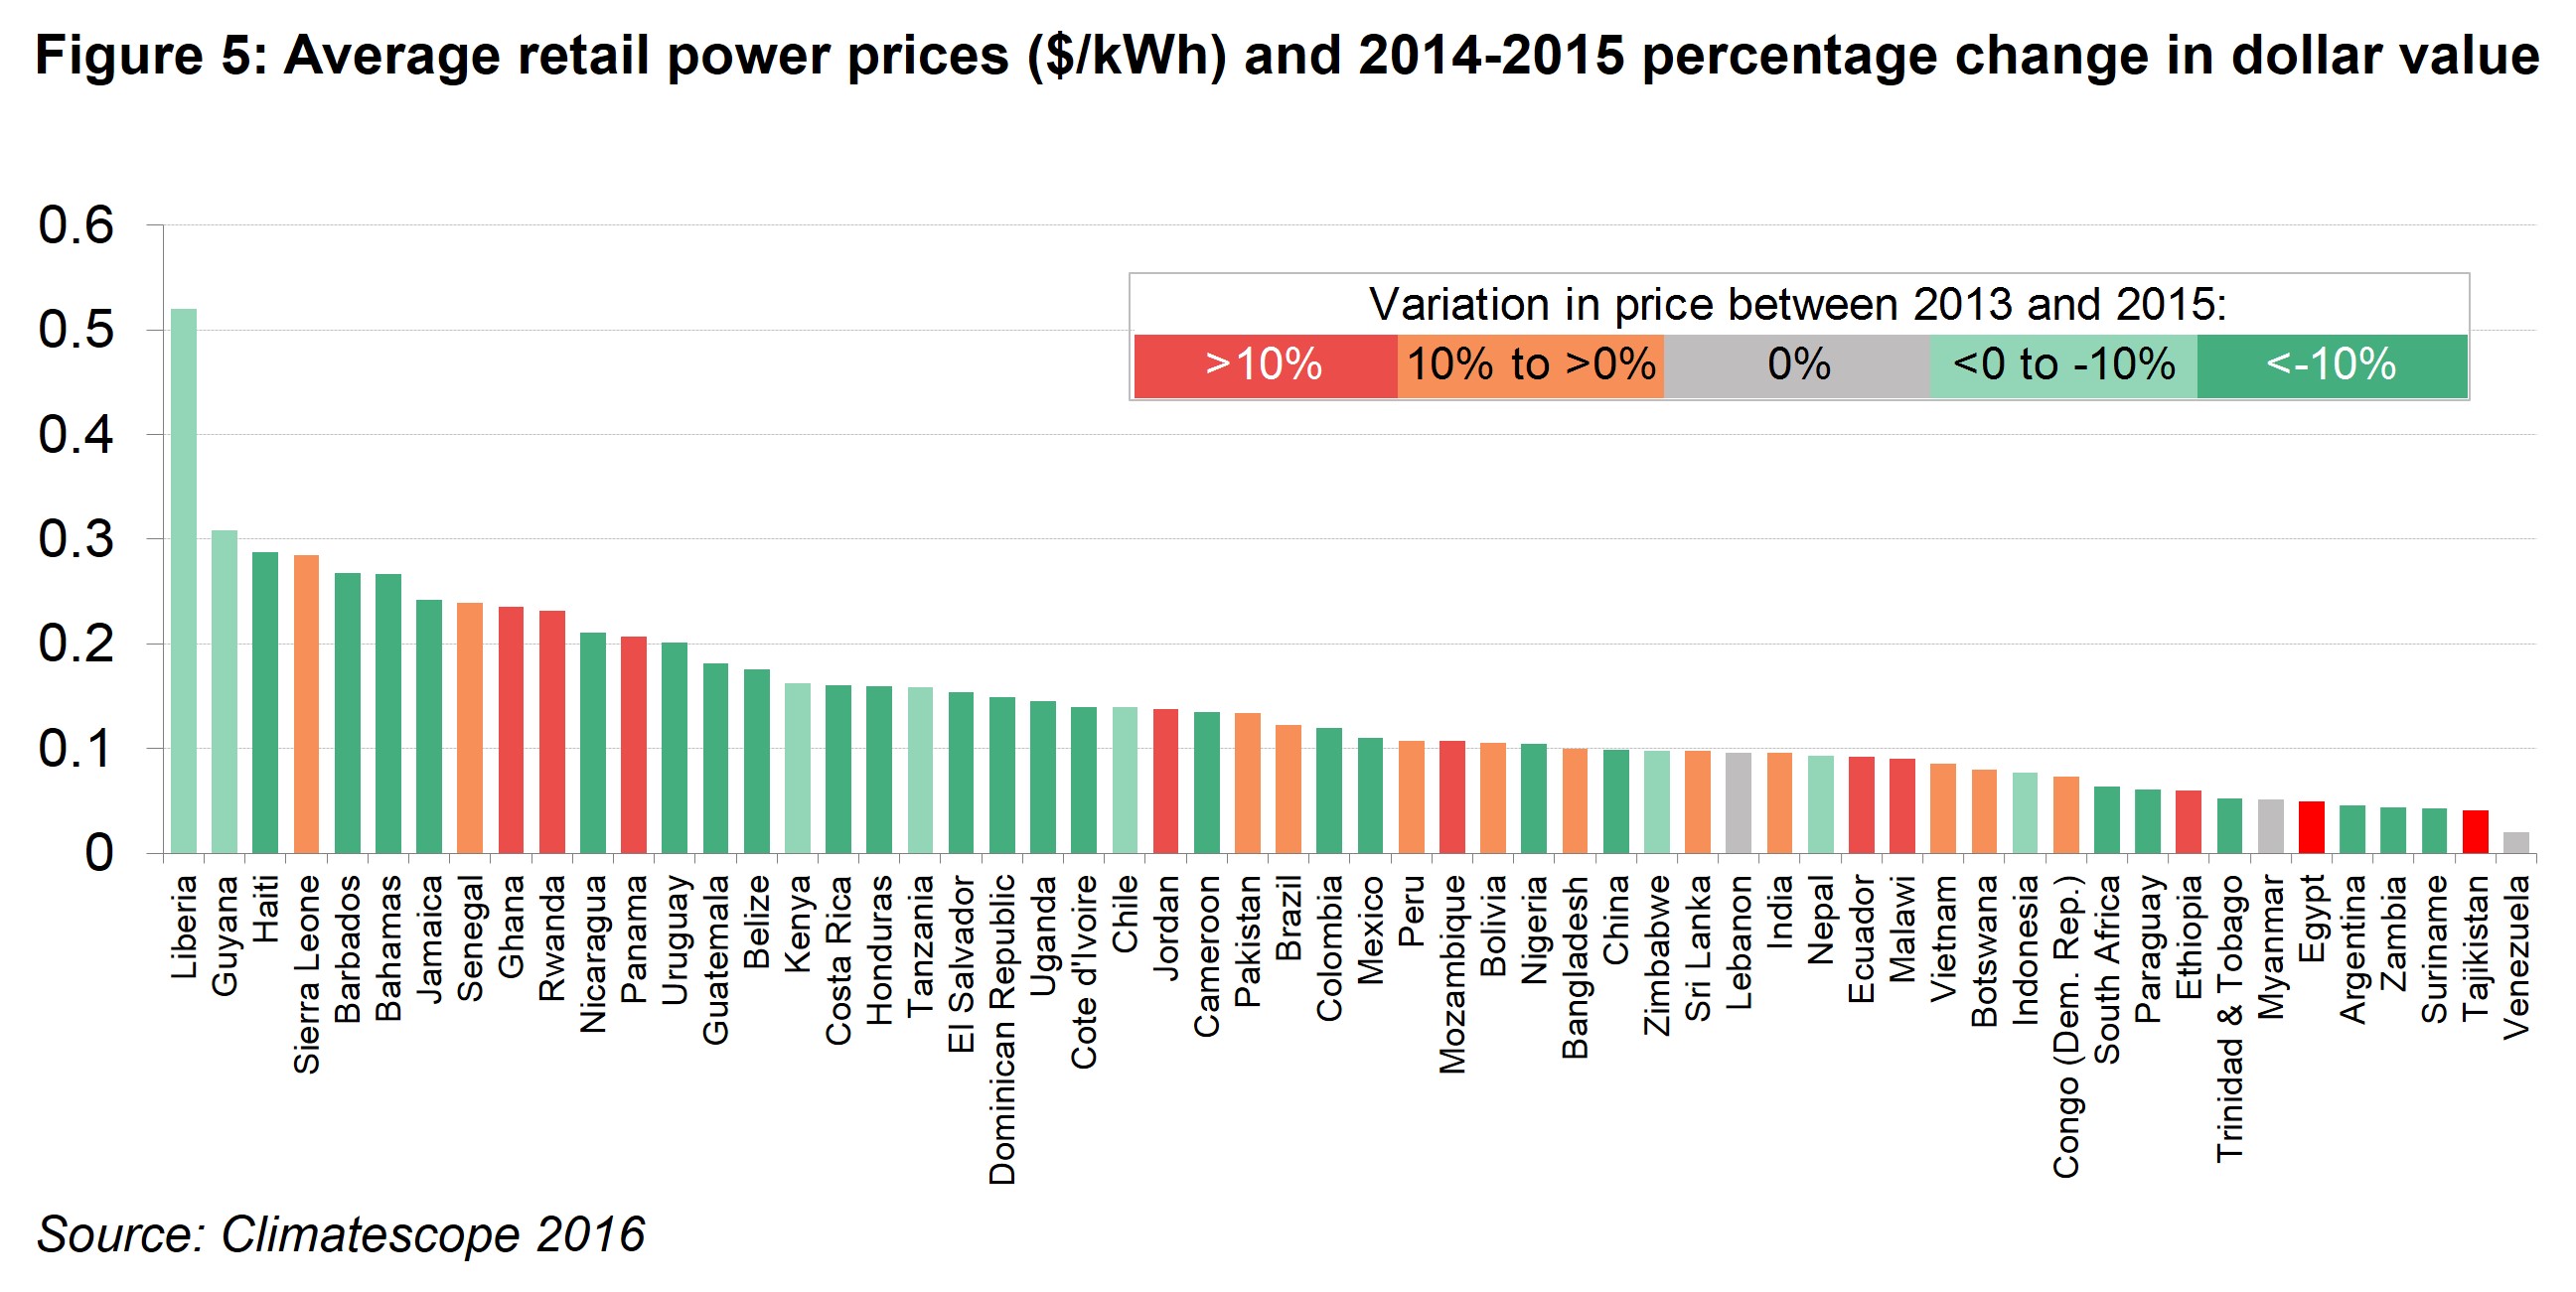
Even with the recent price declines, electricity remains stubbornly expensive in many Climatescope countries compared to wealthier countries. Across the survey’s 58 nations, the average price at which power was sold to the end consumer was $0.14/kWh ($140/MWh) in 2015. By comparison, average retail prices in France and the United States in the same period were around $0.18/kWh and $0.10/kWh respectively.
Such high-priced existing generation offers clear opportunities for renewables, however. In 20 countries, retail rates averaged over $0.15/kWh. Meanwhile, solar project developers now routinely bid to sell their power for under $50/MWh on a wholesale basis (Figure 2). While it’s imprecise to compare retail and wholesale rates, there is little doubt that clean energy has the potential to offset pricier generation reliant on fossil imports.
In Climatescope countries where consumer power prices tend to be heavily subsidised, lower generation costs have one further potential benefit. In such countries, state-run utilities have historically often been forced to sell power at artificially low rates that came nowhere close to covering their marginal fuel costs. As a result, such utilities would regularly run major deficits.
Lower commodity prices have allowed a number of these utilities to repair balance sheets. This, in turn, has the potential to foster clean energy project development, since one of the key impediments to new project build in Climatescope countries is that development finance institutions and other financiers hesitate to finance new wind, solar, or other projects when they have substantial doubts about the financial stability of the local utility committed to buy the power produced over the long term.
This trend toward off-takers with healthier balance sheets is reflected in Climatescope’s off-taker risk assessments (Figure 6).This evaluation included reviewing the off-taker’s financials, history of default and payment delays, the presence of sovereign guarantees and risk perceptions amongst existing renewable and non-renewable generators in the country.
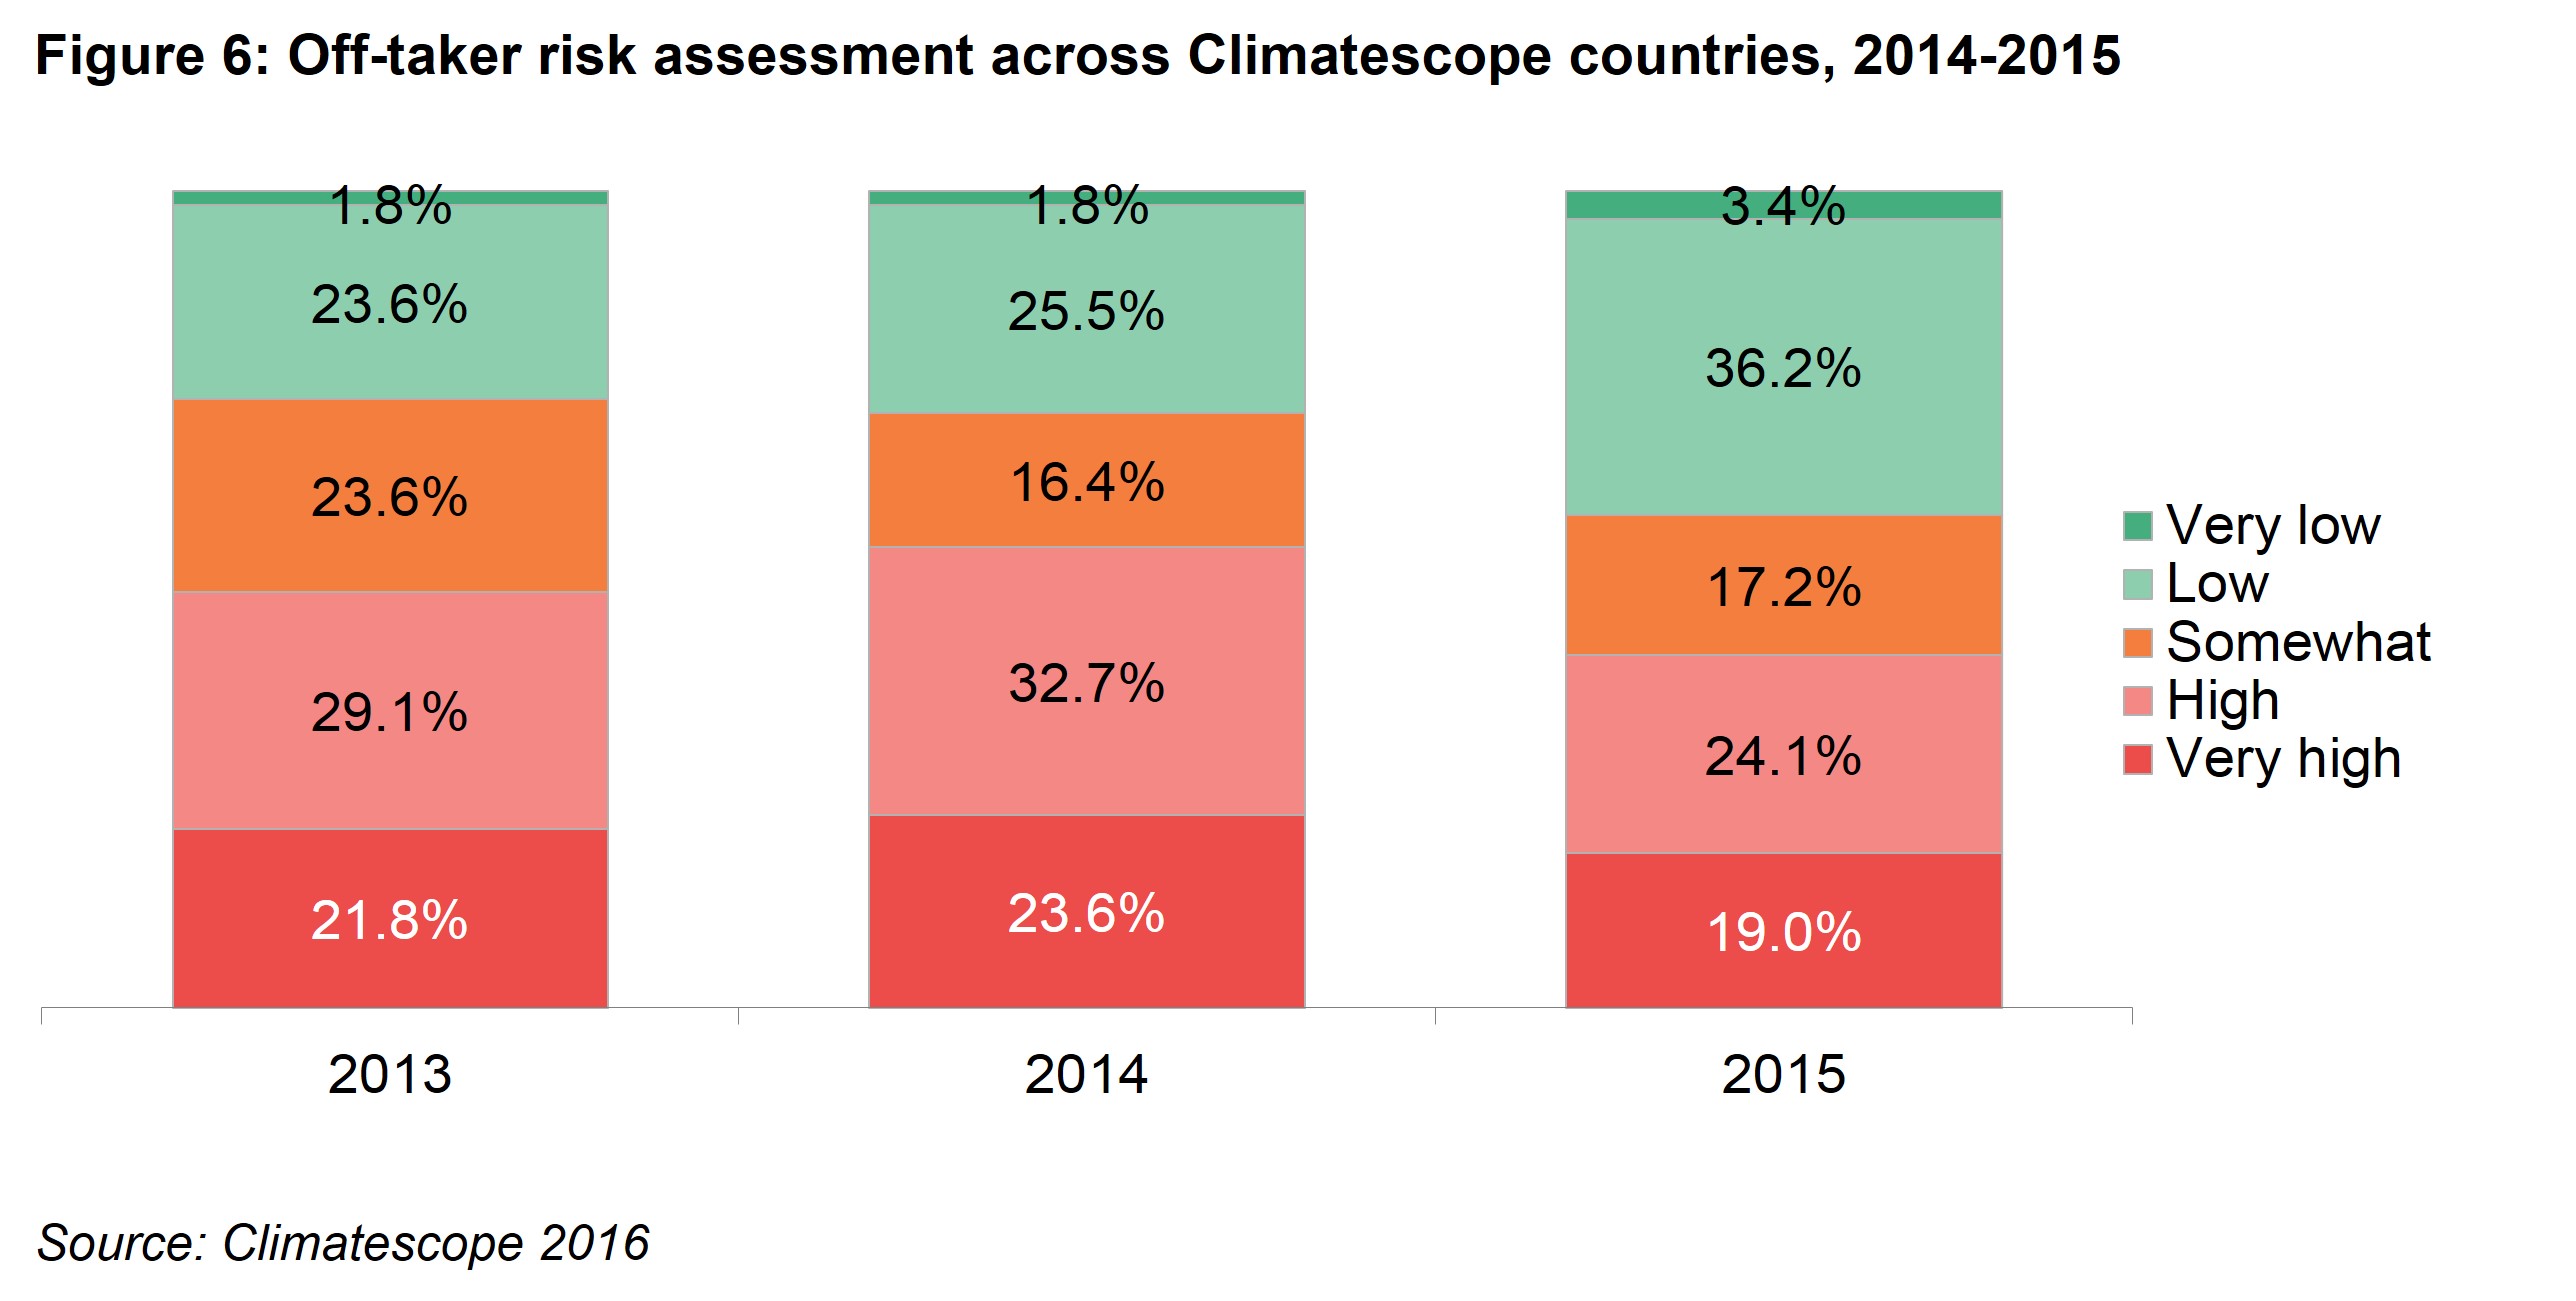
One example of where lower commodity prices have resulted in higher credit-worthiness can be found in Senegal where imported oil accounted for no less than 86% of the country’s power generation in 2014, forcing the government to fund a $200-250m tariff deficit that year in order to avoid an increase in retail electricity prices. The drop in crude prices has relieved budget pressure and allowed the government to avoid increasing retail power prices too quickly. This is improving the government and state-run utilities’ financial situation. This change, combined with cost declines for renewables, appears to be opening space for renewables development. A total of 150MW of onshore wind and 95MW of solar PV, or 25% of currently installed capacity, secured financing in Senegal between the start of 2015 and Q3 2016.
CURRENCY VOLATILITY AND THE APPRECIATING US DOLLAR
Currency gyrations represent major risk for investors looking to put money to work in emerging markets and in recent years the US dollar has appreciated substantially against many local currencies in Climatescope nations (Figure 7 and Figure 8). This is partly due to the unwinding of unconventional monetary policy measures first introduced by the US Federal Reserve in response to the 2008 financial crisis.
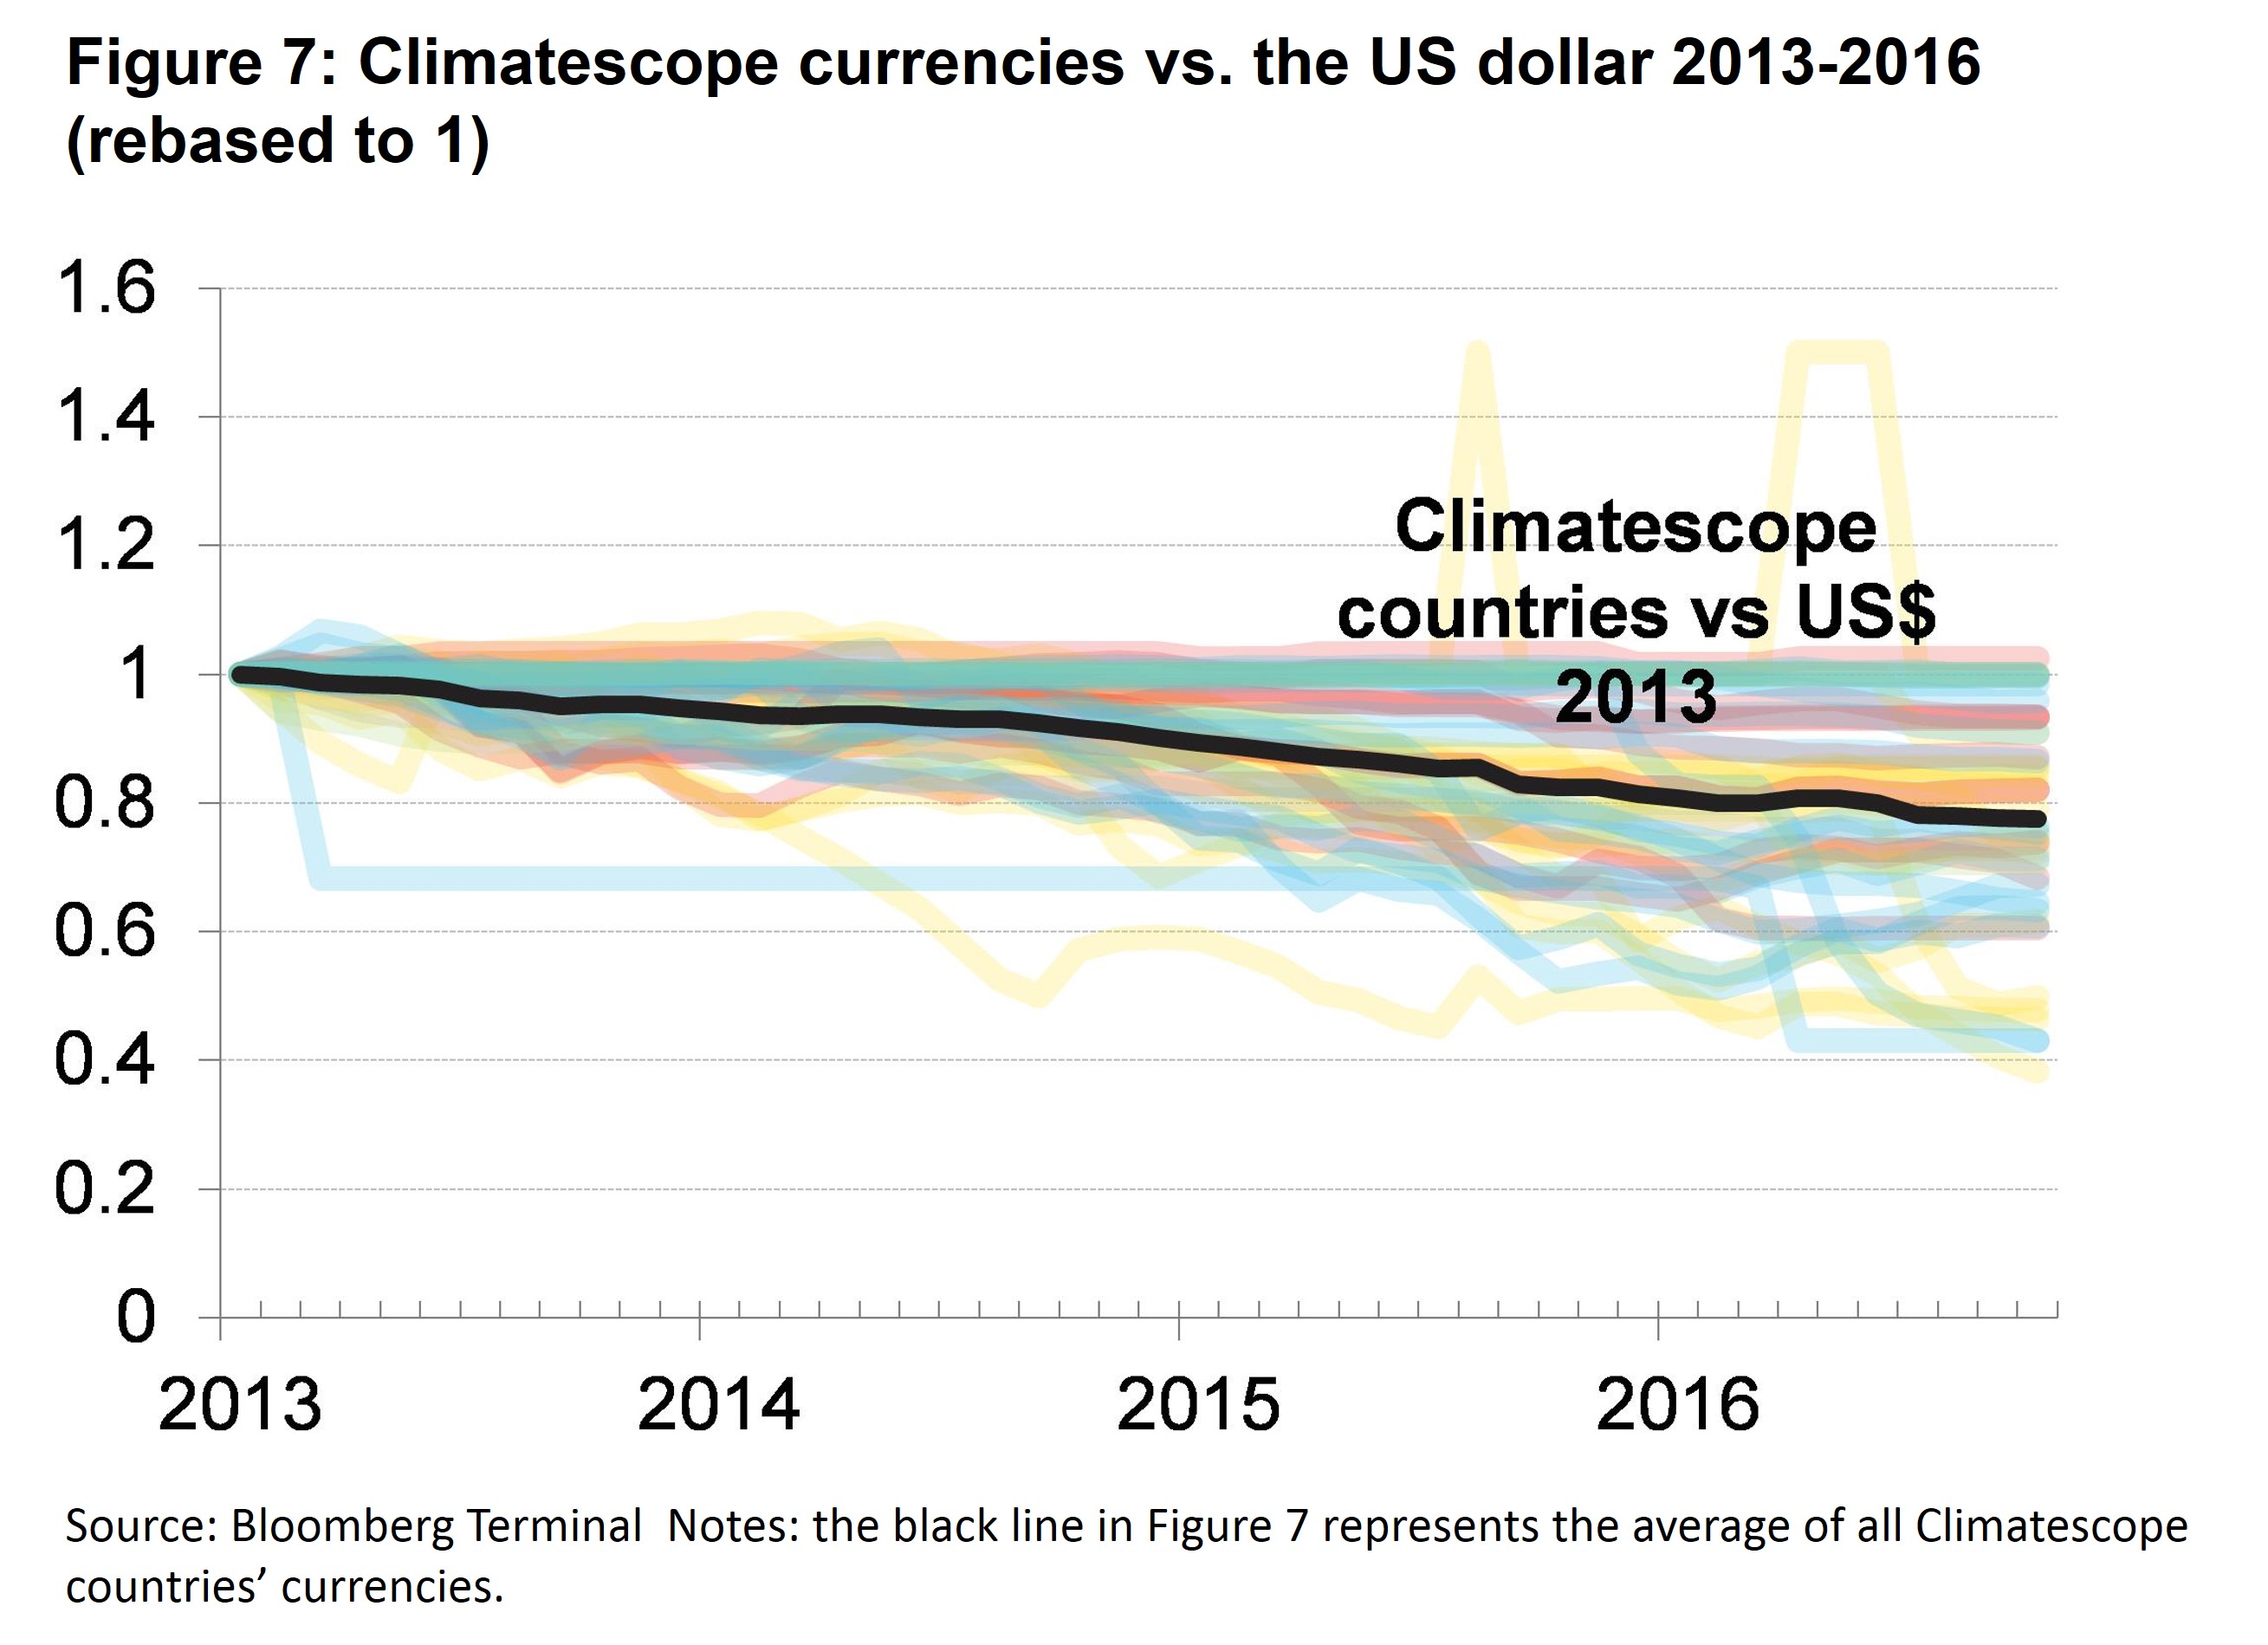
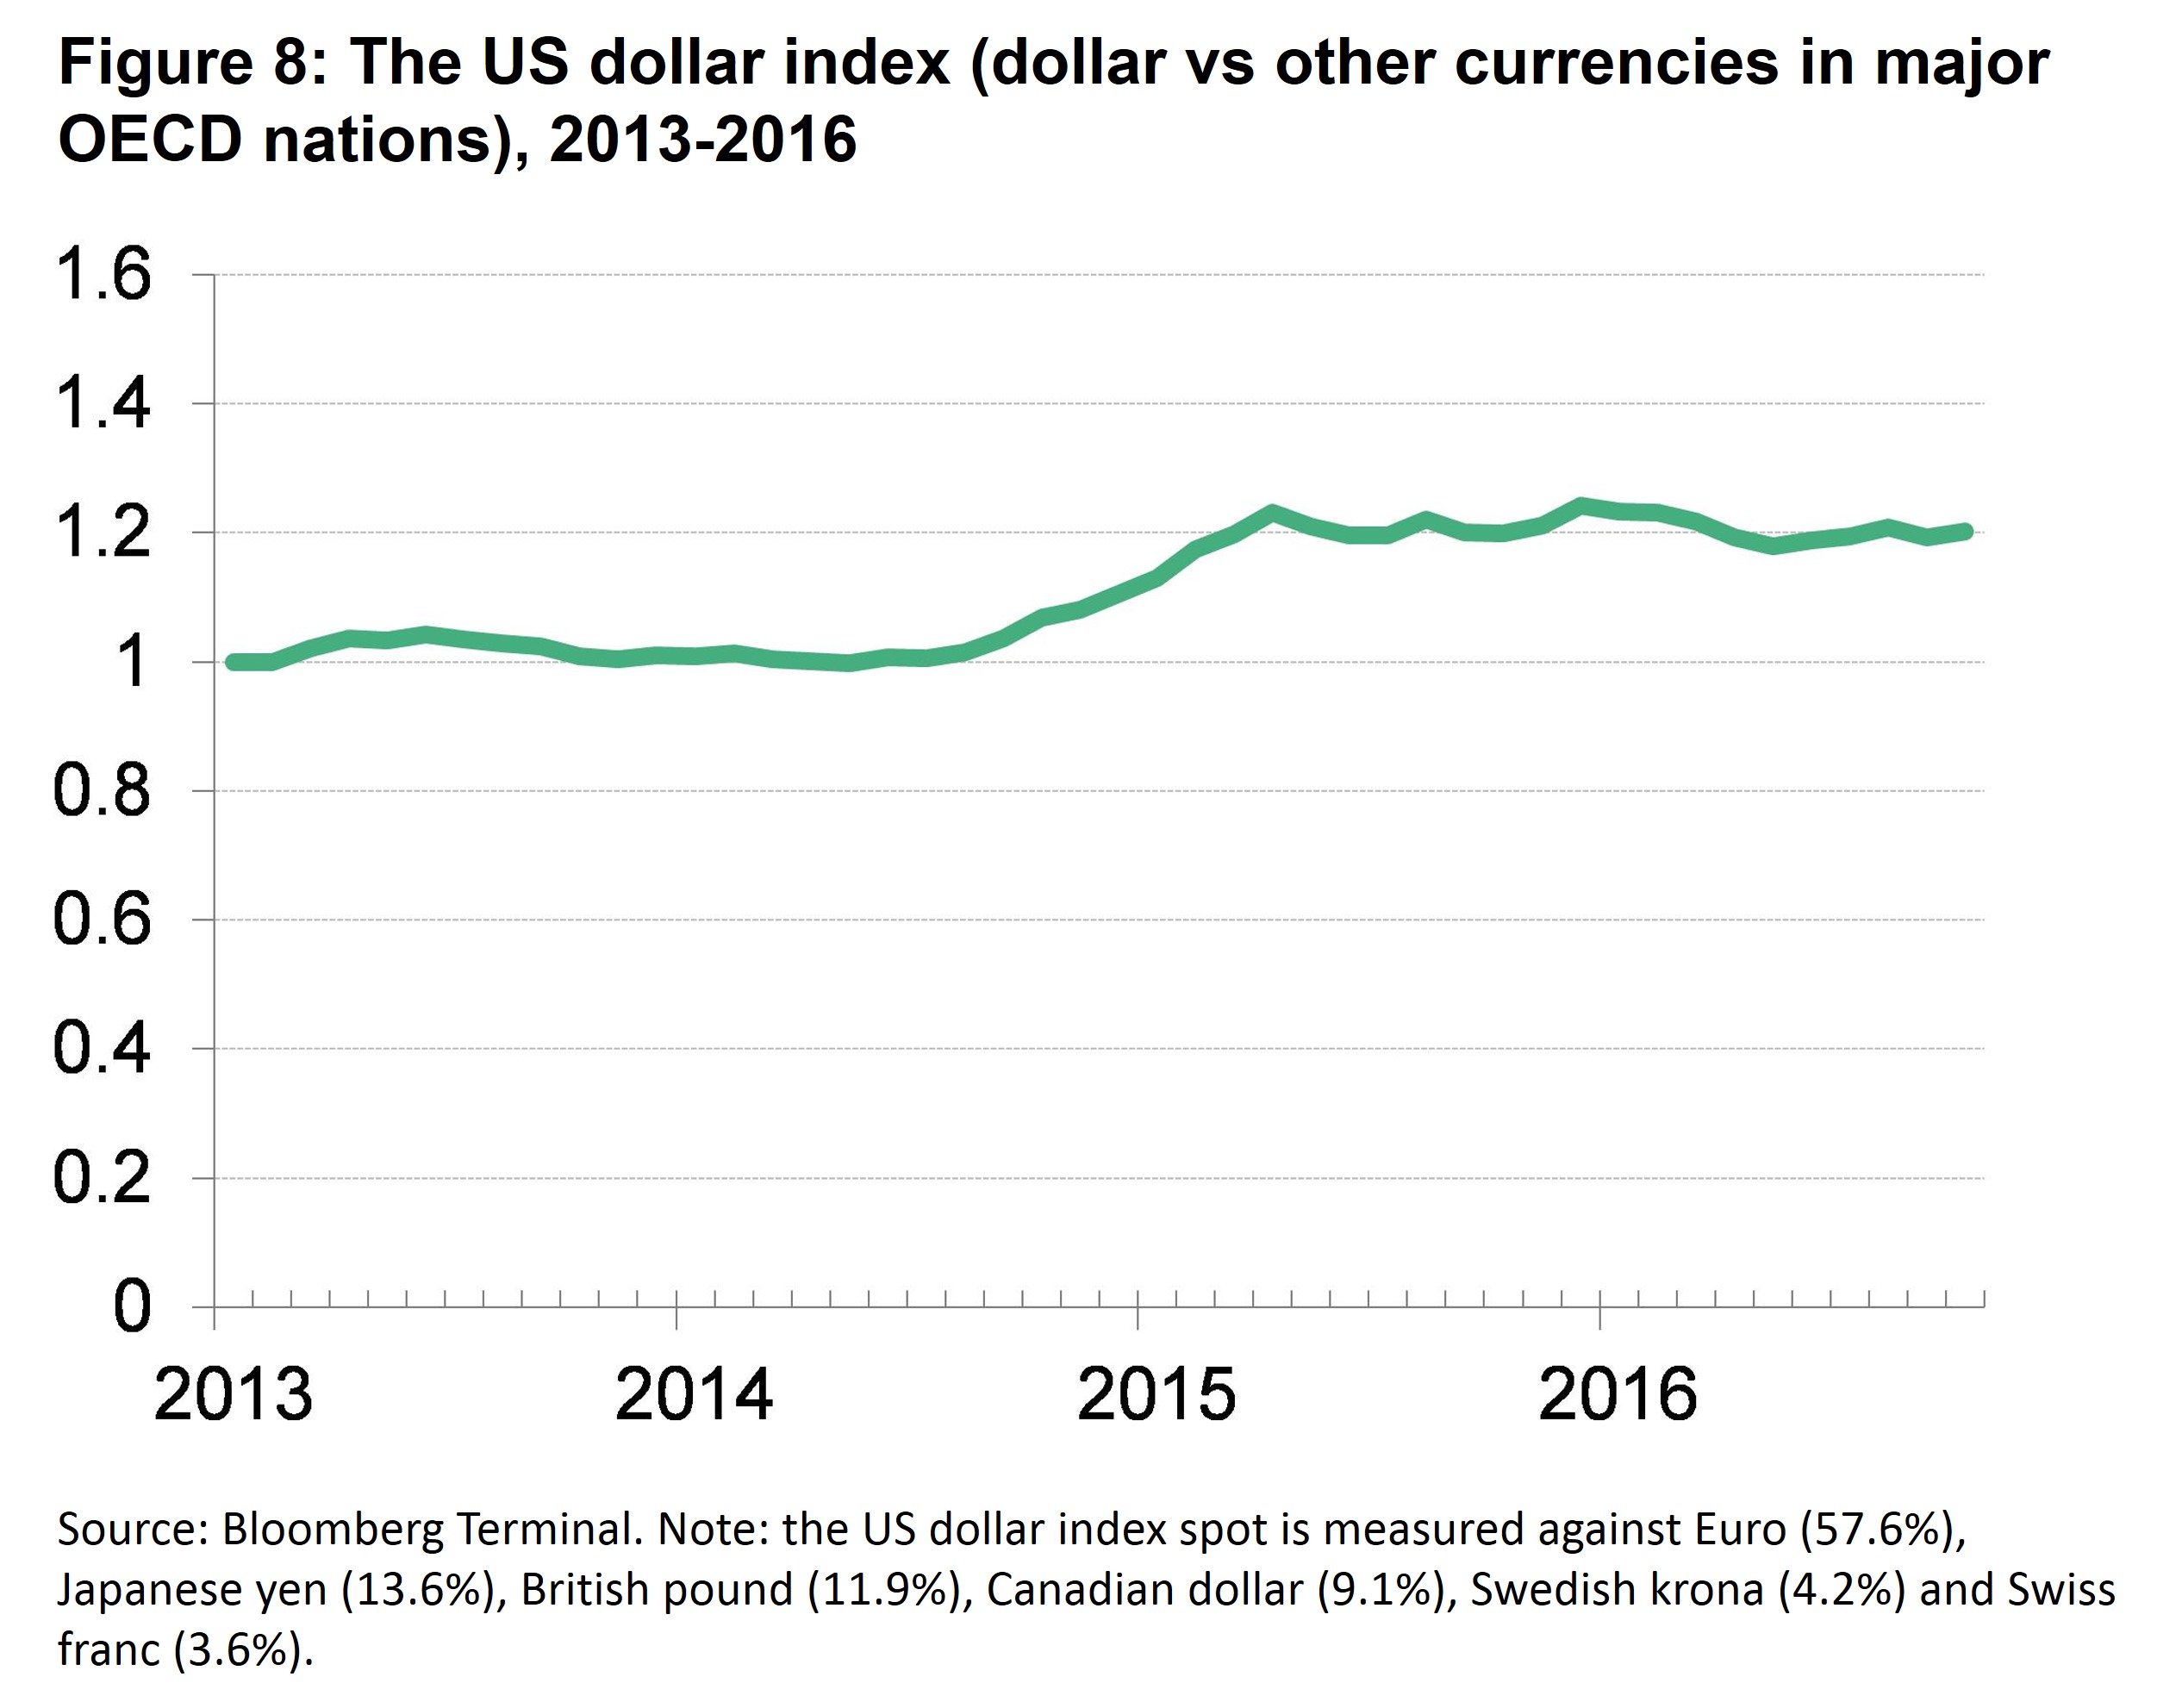
The appreciation of the dollar affects Climatescope countries differently depending on the characteristics of their economies and their clean energy markets. Those most reliant on imported goods and services to develop clean energy projects have seen the higher dollar boost local costs.
Only a few countries – namely China and, to a lesser degree, India - currently employ almost entirely domestically-made equipment. Generally speaking, the more domestically-oriented a country’s clean energy manufacturing, the less exposure local developers have to an appreciating dollar.
The vast majority of Climatescope’s 58 nations rely on trading partners to secure wind turbines, solar modules, and other equipment, however. When US dollar prices for such gear spike unexpectedly due to local currency declines, local project developers are hit.
Efforts to address this include state-run utilities agreeing to long-term contracts, sometimes explicitly denominated in dollars, or local governments essentially agreeing to backstop shortfalls caused by currency changes. While risks associated with currency fluctuations can be shifted to different parties, they cannot be eliminated. For example, South Africa’s state-run utility Eskom has signed multiple 20-year power purchase agreements backstopped by the South African government. The arrangement has helped spur just under $16bn in clean energy investment representing around 9GW of contracts, since the programme was launched in 2011. It has also added $13bn to the South African Treasury’s liabilities, the equivalent of around one third of South Africa’s foreign exchange reserves as of July 2016, according to Bloomberg.
Risks aside, such long-term commitments to address the currency question have clearly helped clean energy projects get financed and built. Indeed, Climatescope countries where project owners can receive payments in dollars or have their contracts otherwise indexed or insured against currency changes have seen some of the strongest levels of investment to date.
1 The countries with no active legislation are Sierra Leone, Suriname, Trinidad & Tobago and Venezuela.
Regional average
- %% region.name %%
- %% region.parameters[0].data[0].mean | round:2 %%
| Topic rank | Country | Topic score | Trend | 0.0 - 5.0 Average: %% countryTable.scoreAvg | round:2 %% | Grid |
|---|---|---|---|---|---|
| %% country.data[0].overall_ranking | leadingZero:2 %% | %% country.name %% States | %% country.data[0].value | thousands:2 %% |
|
%% country.grid %% |