Financing and investment
Topic
PARAMETER II – FINANCING AND INVESTMENT
Climatescope’s Clean Energy Investment & Climate Financing Parameter (Parameter II) encapsulates nine contributing data indicators. It accounts for the amount and growth of clean energy investment in projects larger than 1MW in each country, the availability of local funds and local financing costs. Parameter II contributed 30% toward each nation’s overall score.
KEY FINDINGS
Investment volumes across Climatescope countries overall continued to climb in 2015 and achieved an all-time high of $154.1bn, up from $129.3bn in 2014. Investment in China, which accounts for three quarters of total Climatescope investment (and about one third of all global investment), grew 28% and helped drive top-line growth. However, activity is clearly spreading to other nations. Excluding China, the 10 countries which saw the highest level of clean energy investment attracted $37.4bn in 2015 compared with $28.2bn in 2013. An impressive 38 of 55 countries reviewed in this year’s Climatescope and last year’s edition saw their investment scores improve. Amongst the three nations added to the survey this year, Jordan stood out by scoring 1.62 out of a maximum of 5 and joining the top 10 list on this parameter.
CLIMATESCOPE COUNTRIES TOP ALL OTHERS FOR THE FIRST TIME
Climatescope countries for the first time attracted more new clean energy investment than nations member of the Organisation for Economic Co-operation and Development in 2015 (Figure 1). Investment in Climatescope countries grew 16% from 2014 to 2015 to reach $154bn, somewhat below the 2013-2014 jump of 24%. In addition, the $147bn invested into new clean energy generation in Climatescope nations in 2015 topped the $126bn global investment in thermal power generation in 2015 recorded by the International Energy Agency1.
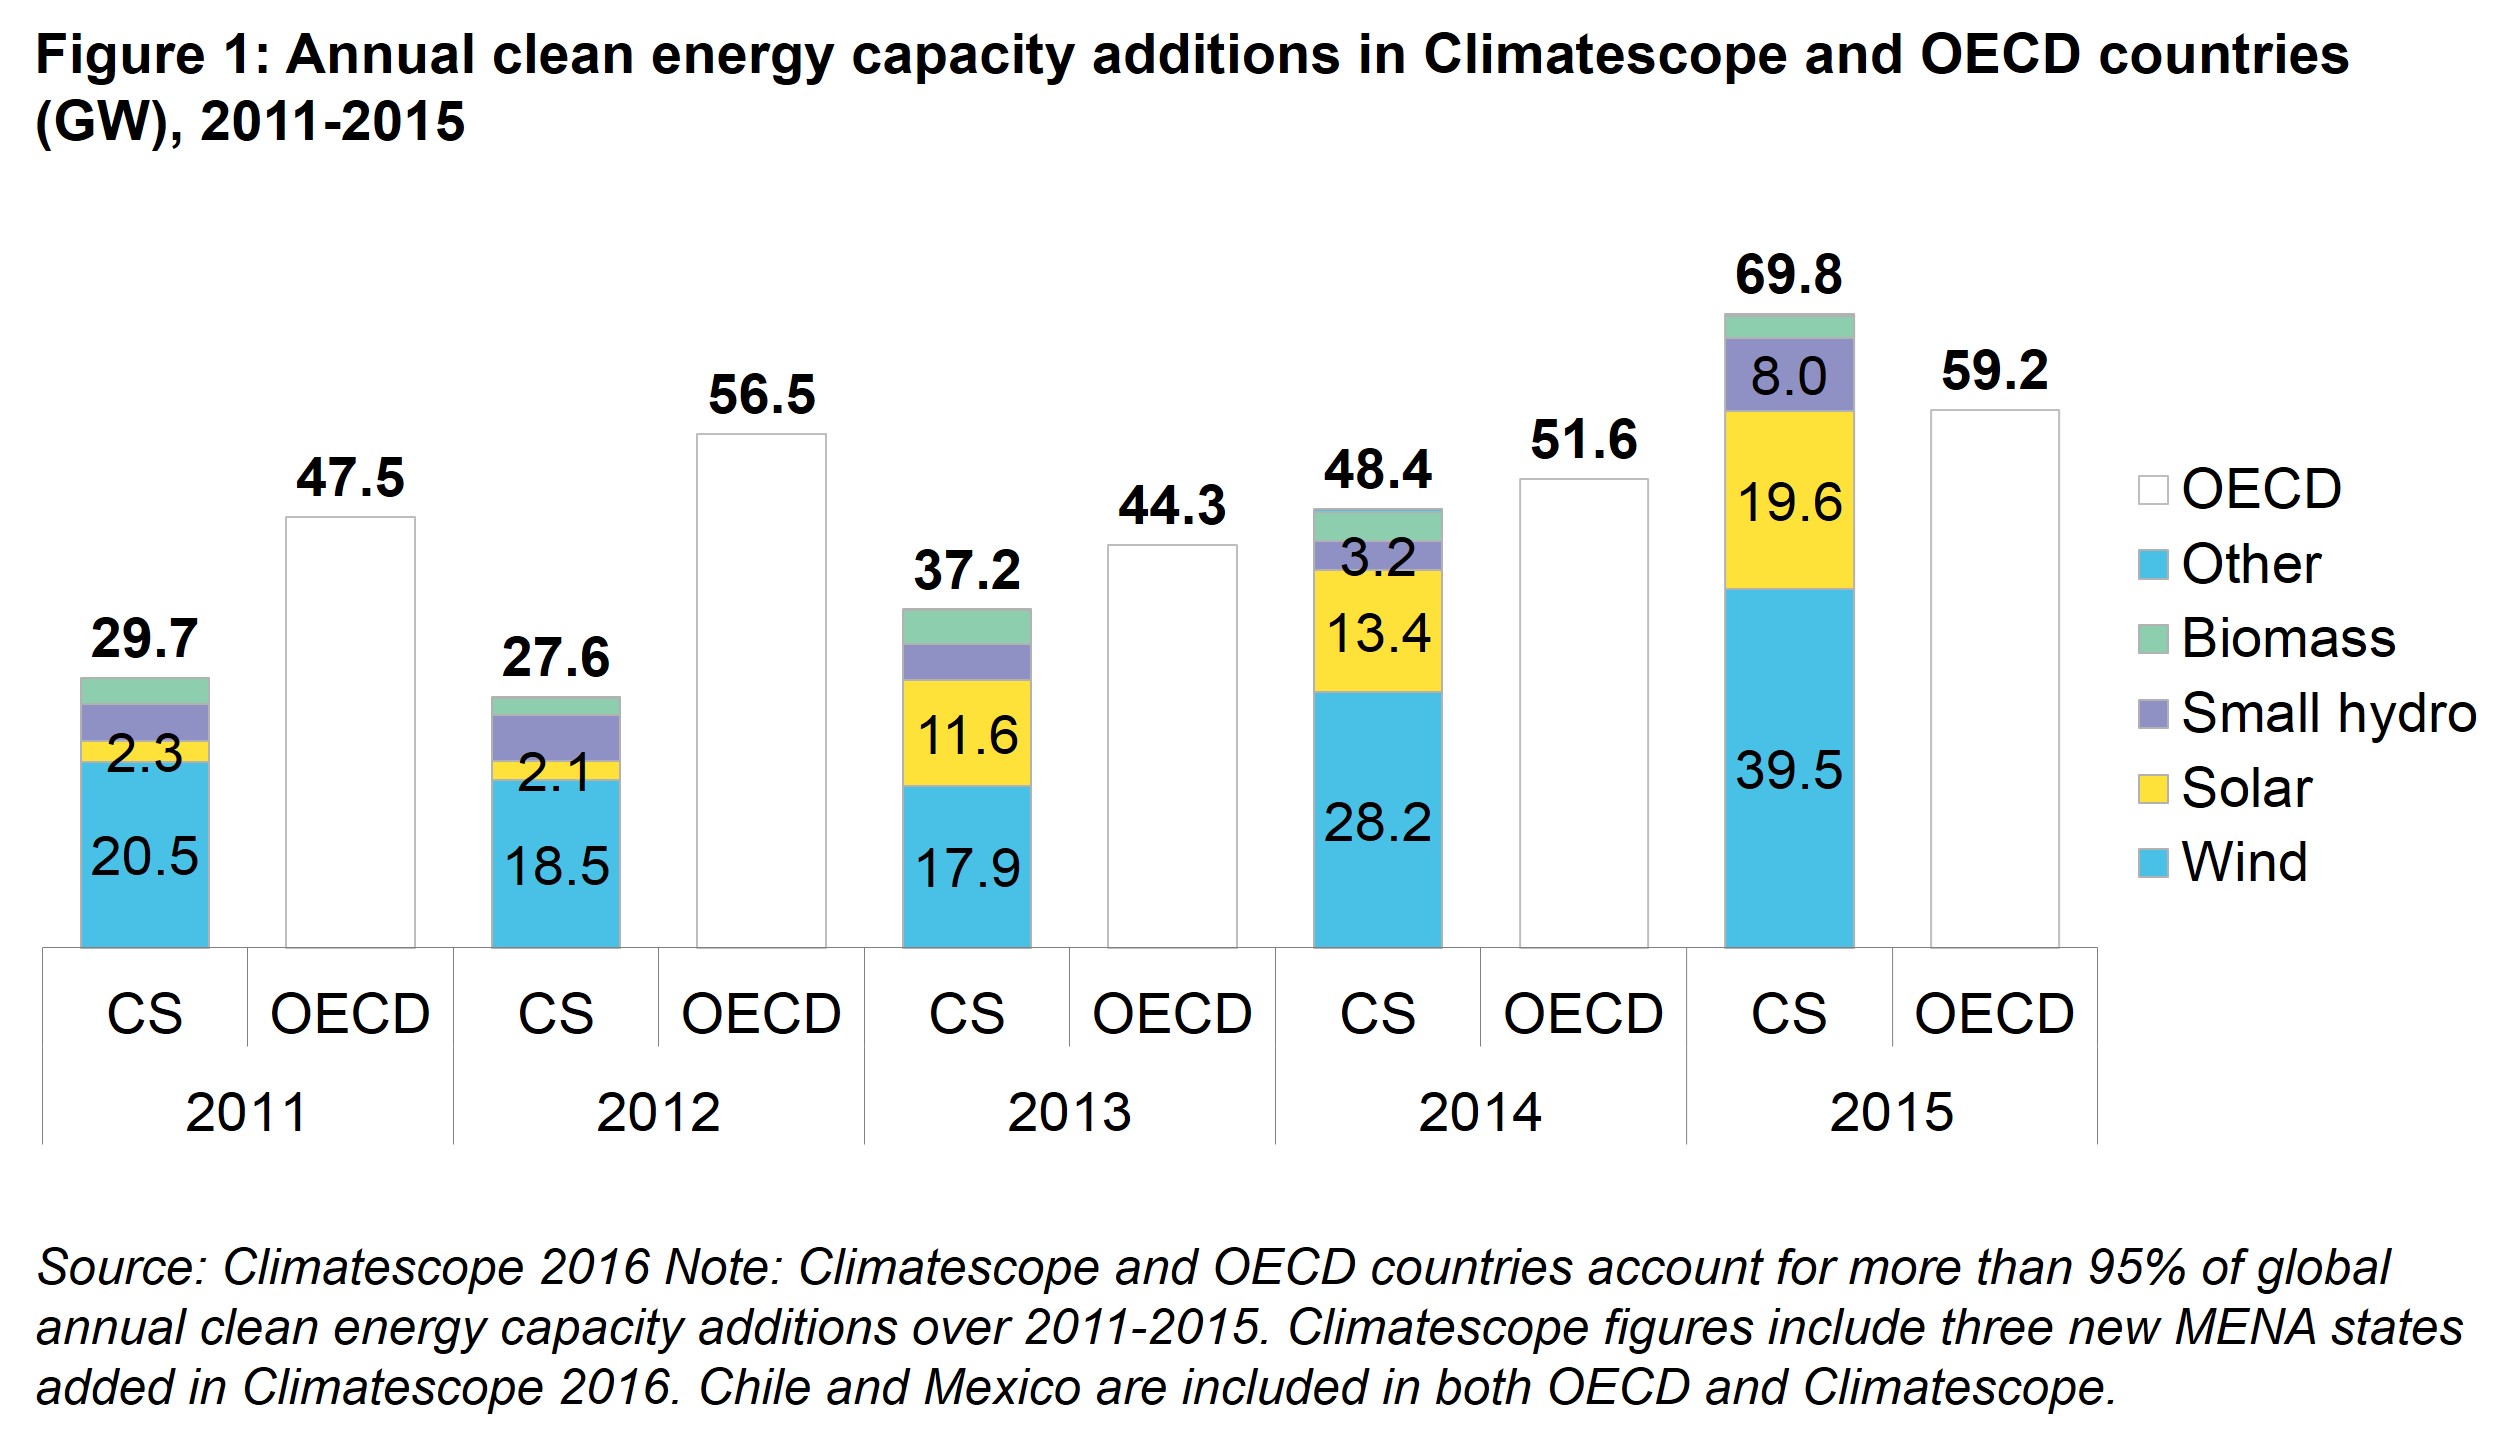
Solar and wind accounted for 46.5% and 47.5% of this, respectively, and other renewable technologies for the remainder. The growth in solar is astonishing given that the technology only attracted $6.4bn in Climatescope countries in 2010 vs. $45.9bn for onshore wind that year. Five years on and solar investment is up tenfold and is likely to top onshore wind for the first time in 2016. Behind this lies a story of cost declines; solar equipment prices are down approximately 90% since 2009.
INVESTMENT PERFORMANCES VARY GREATLY
Climatescope countries collectively had another exceptional year in 2015. Still, there continues to be substantial variation between the countries in which investors are continuously active and the rest (Figure 2). Ten countries2 in Climatescope saw clean energy investment exceed $4bn between 2010 and 2015. At the other end of the spectrum, 10 countries3 have failed to attract any clean energy investment in projects larger than 1MW at all since 2010 and most countries have seen less than $600m4 of investment over the 2010-2015 period.
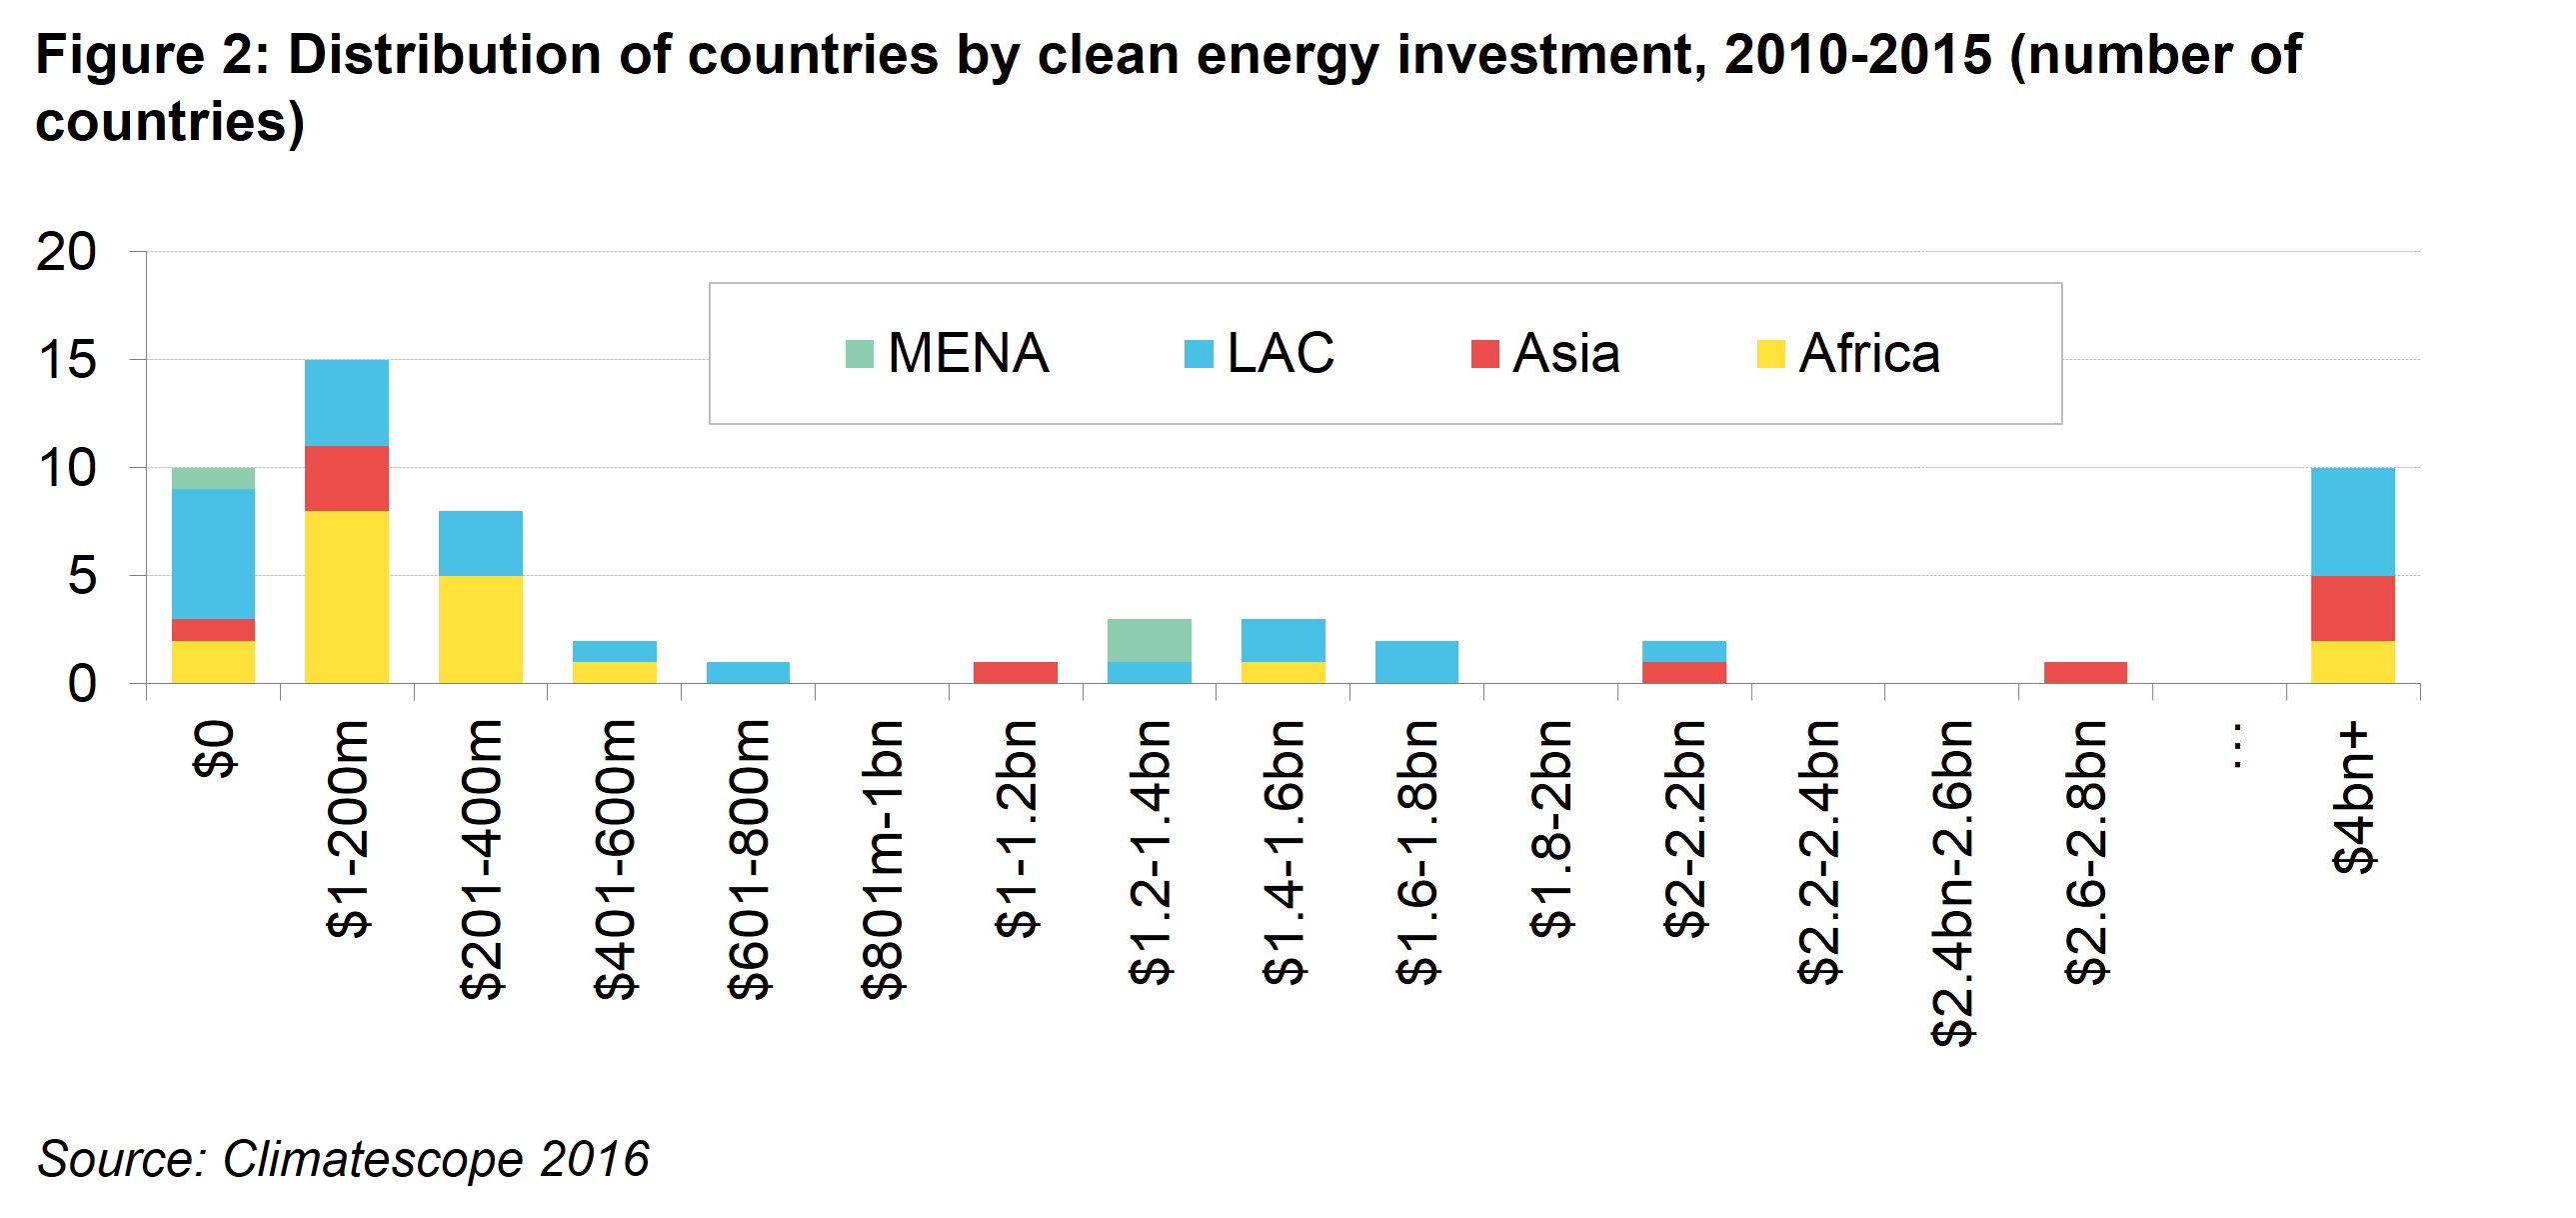
Somewhat understandably, the countries with the smallest economies were also fairly likely to get overlooked by investors. In fact, six of the ten smallest Climatescope economies were amongst the countries with no investment between 2010 and 2015. Hence it is clear that the absolute level of investment alone is an imperfect indicator of activity.
Looking at investment as a share of the economy size paints a different picture (Figure 3) which is the reason why all quantitative indicators in Climatescope are levelized against a country’s GDP and population.
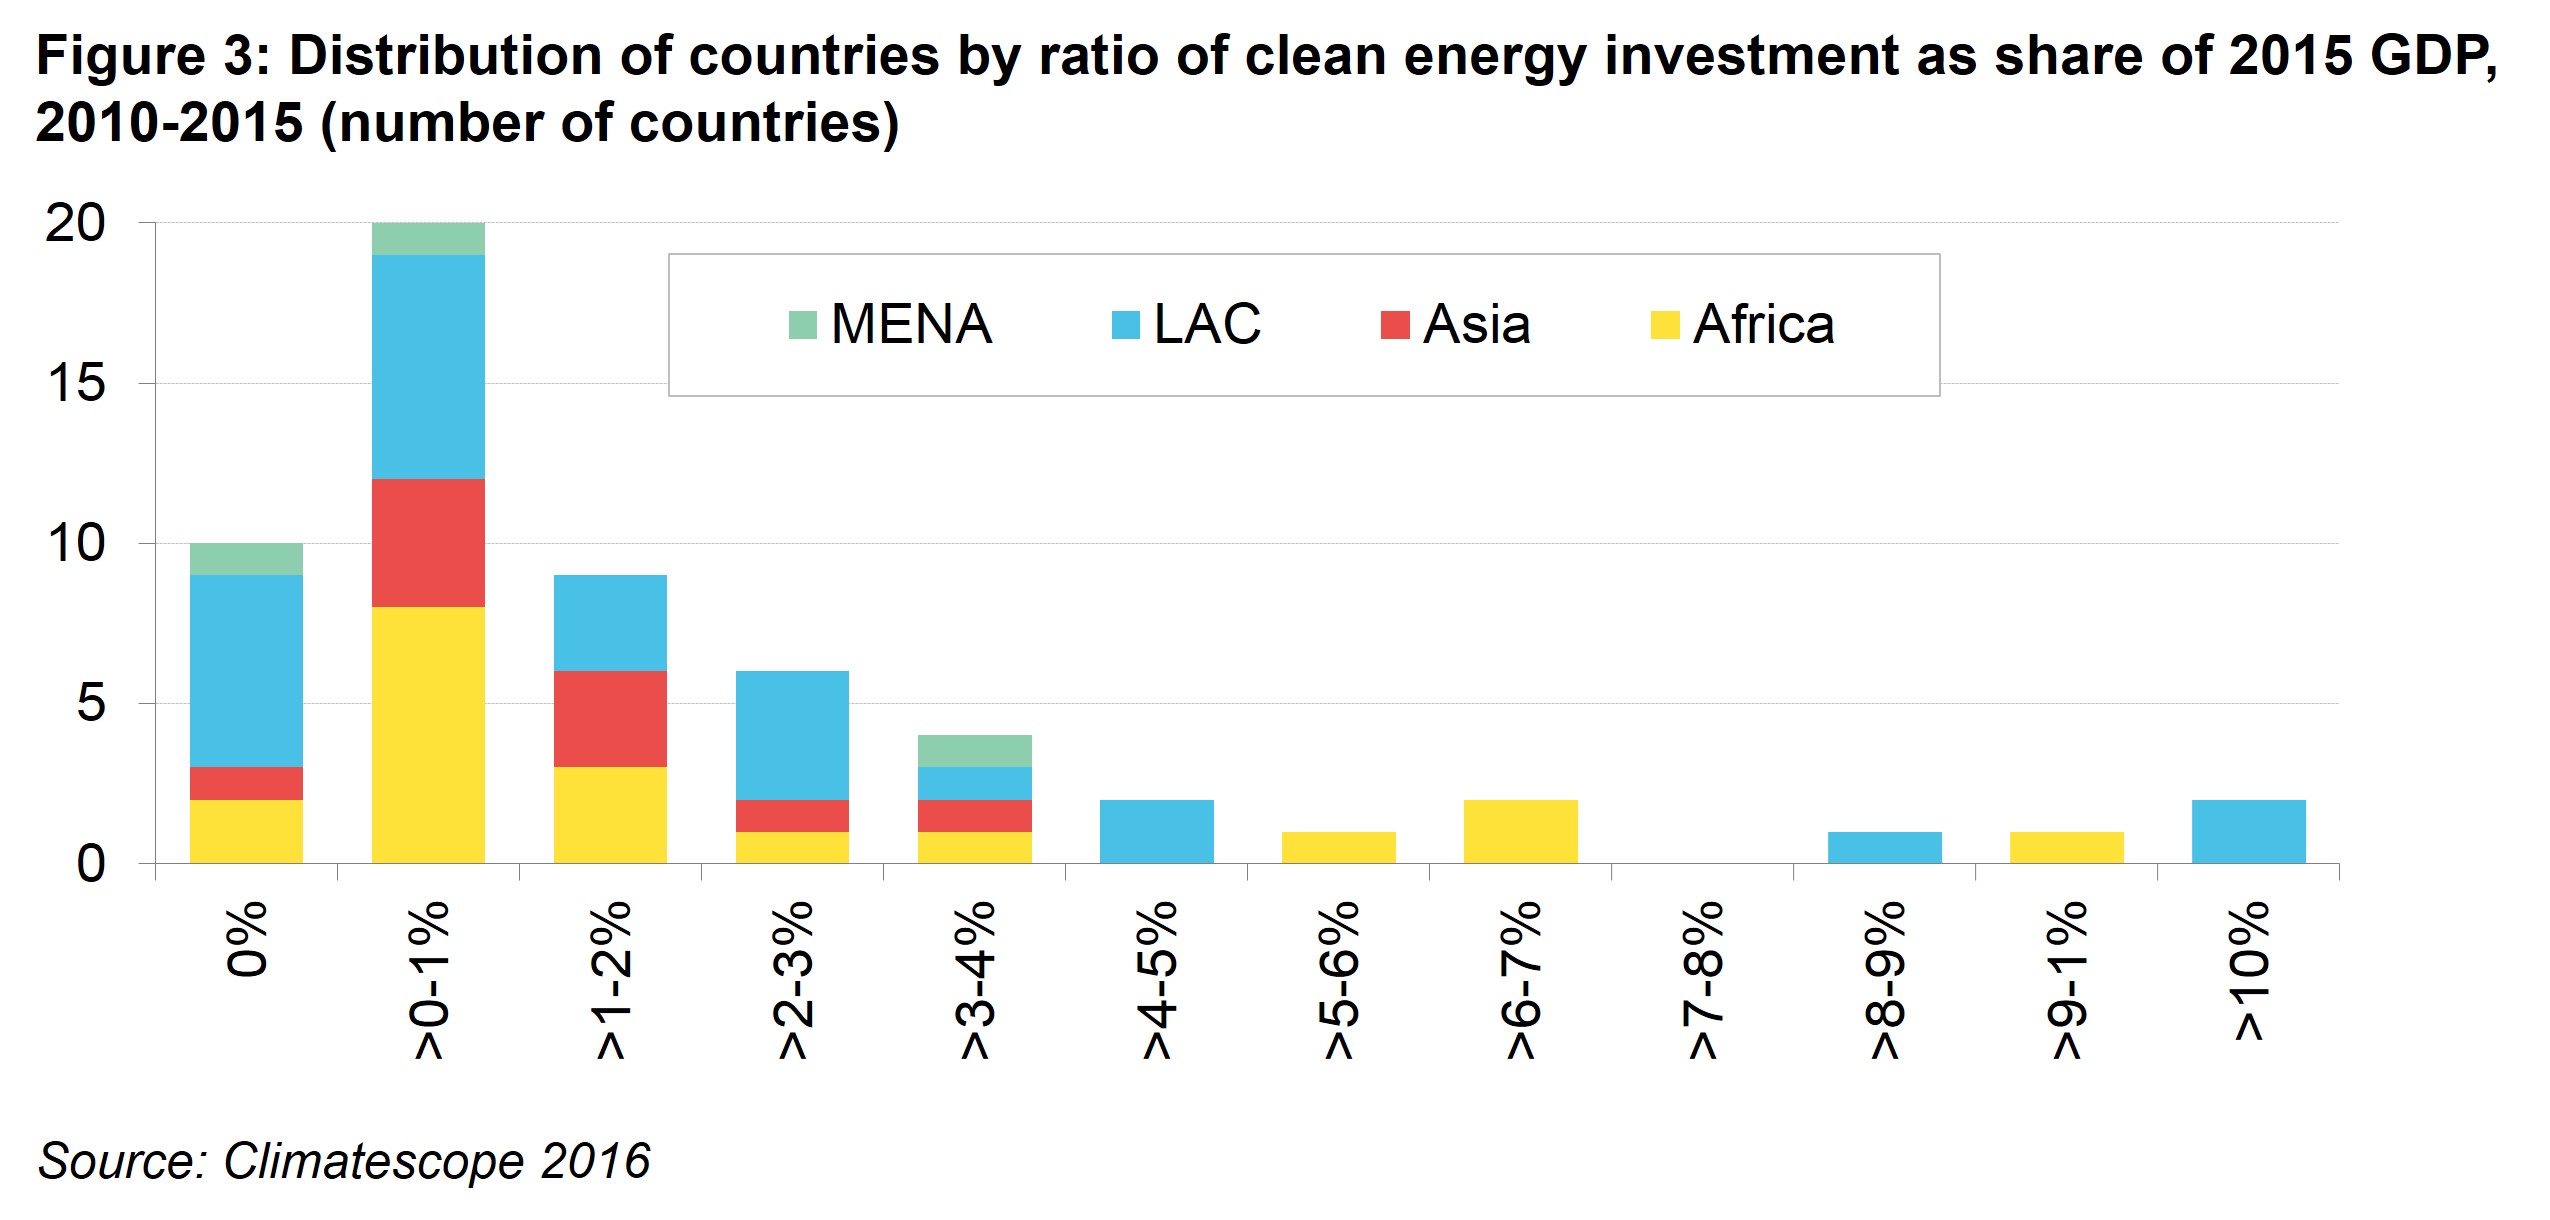
When investment is measured against a country’s GDP, Uruguay (8.76% of 2015 GDP), South Africa (5.14%), Chile (4.69%), Brazil (4.23%) and China (3.81%) are the only countries that remain in the top 10. Nicaragua (10.47%), Honduras (10.06%), and Kenya (6.68%) are the other countries with investment in excess of $1bn between 2010 and 2015, completing this ranking. Sierra Leone (9.15%) and Zimbabwe (3.69%) are also in the top 10. However, this is caused by the presence of large one-off bioenergy deals in these small economies. At the other end of the scale, countries such as Nigeria, Indonesia, Colombia, Argentina and Ecuador have seen underinvestment in relation to the size of their economies.
Among those at the top of the list, the performances are not just impressive when compared to other developing countries but also when viewed against the performances of some of the very largest economies. Consider that Honduras, Kenya, Nicaragua and Uruguay have all recorded investment over 2010-2015 that is equivalent to more than 5% of their 2015 GDP while Germany and China have generated investments equivalent to 3.8% over a similar period.
EVOLVING CLEAN ENERGY INVESTOR TYPES IN EMERGING MARKETS
Bloomberg New Energy Finance has been tracking and categorizing investment flows into the clean energy sector for over a decade. This data allows for a unique look at the evolution of investor types across Climatescope nations (Figure 4).
China is excluded from the below charts due to its sheer size and the large number of projects in the country for which no public data exists on investor type. However, BNEF research has found that the majority of new projects in China are developed by commercial banks and project developers. This marks a shift from the period before 2010, when the development banks were heavily involved. Utilities and private equity funds have had little activity in the country to date.
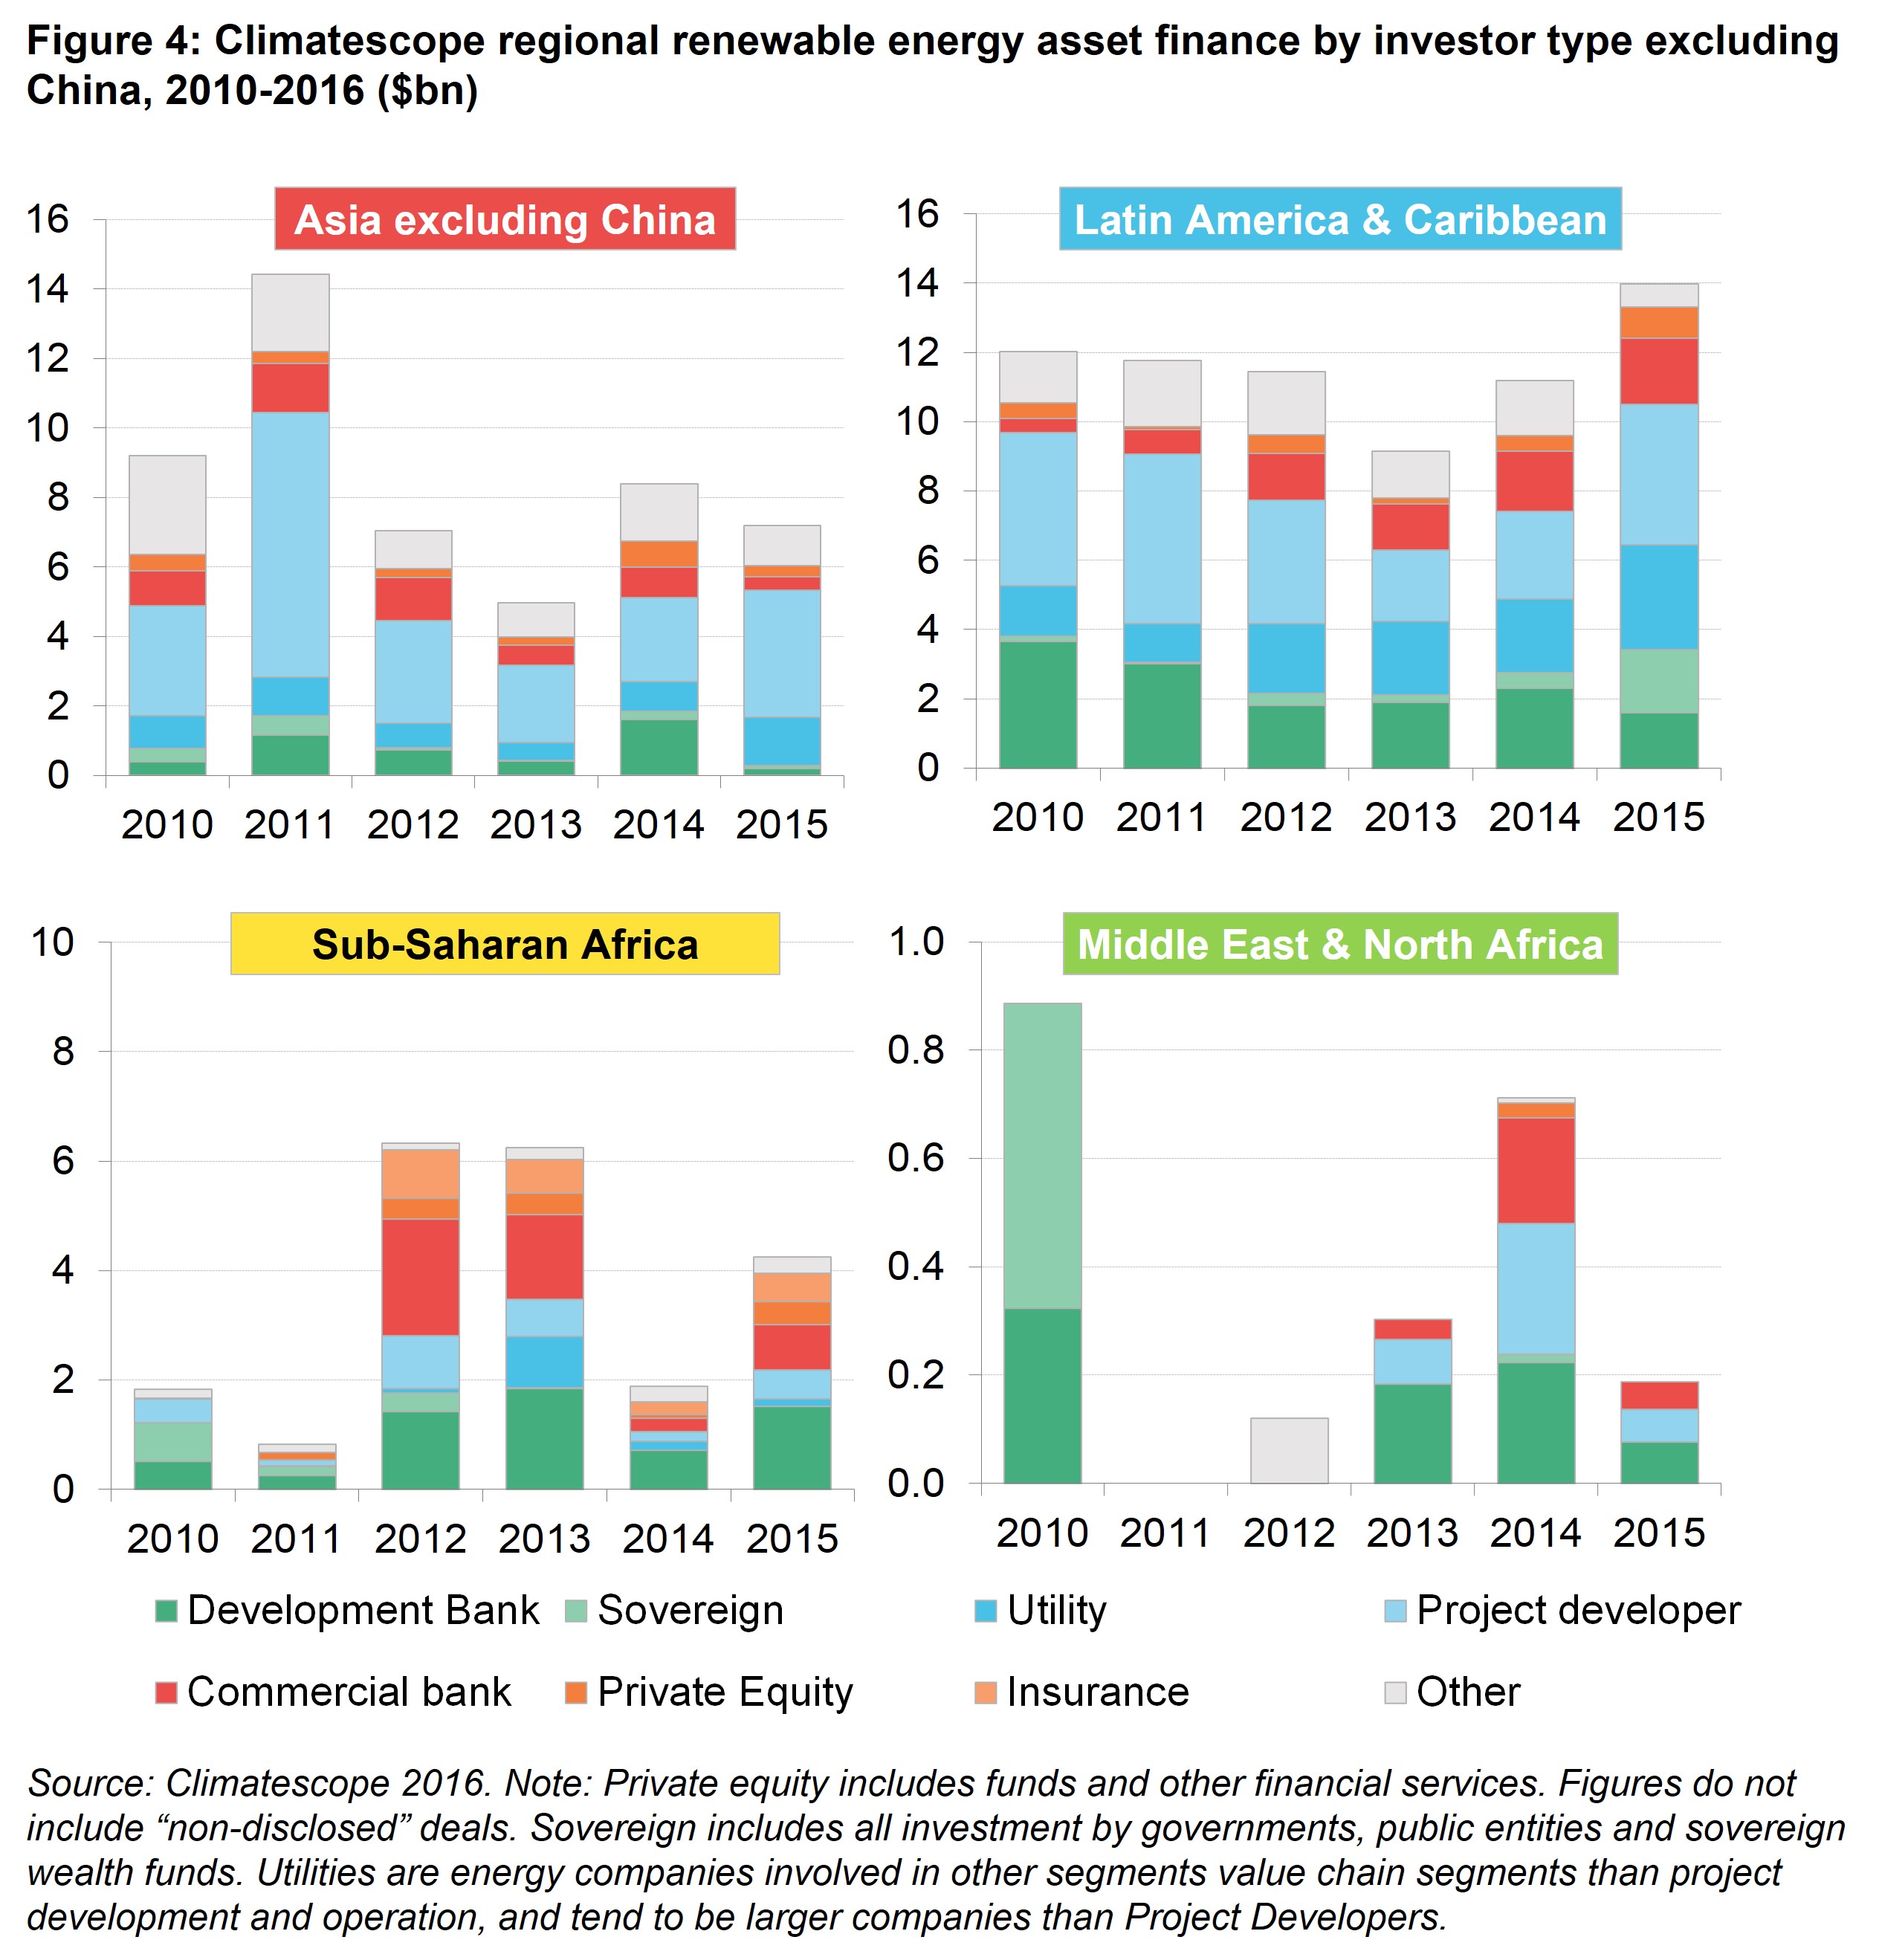
Project developers have provided around one third of all the capital across Climatescope nations and are by far the largest source of clean energy investment in these nations. Their role is particularly strong in Asia and in the Latin America and Caribbean region, where they have seized opportunities presented by large-scale auction programs in India, Brazil, Mexico and elsewhere.
Latin America is also the region which has seen the most activity from multinational utilities, which have tapped their own balance sheets. However, as in the early years of some mature clean energy markets, utilities’ share of clean energy investment is relatively small when compared to that of project developers.
This appears to be changing. Clean energy finance from utilities grew at an average rate of 21% per year from 2010-2015 compared to 9% for finance from project developers globally. Italy’s Enel, Brazil’s Electrosul Centrais Electricas, Japan’s Kyushu Electric Power and Spain’s Acciona are among those that have financed over $1.5bn of renewable energy assets in Climatescope countries between 2010 and 2015.
In Sub-Saharan Africa, commercial banks have been heavily involved in South Africa where they have played an active role in financing projects executed under the government’s Renewable Energy Independent Power Producer Procurement programme. Sub-Saharan Africa is also the region where development finance5 has been prominent (Figure 4).
In the Middle East, development banks have played a greater role as the risks are clearly viewed as too high for many commercial institutions. In Egypt, for instance, the 200MW El Zayt wind farm was financed in 2010 by European sovereign and development institutions, Japan’s International Cooperation Agency and the government of Egypt itself. Development finance has been leveraged effectively in Jordan where five of seven clean energy projects to date have involved such institutions, project developers and commercial banks. In a promising sign, the other two projects there were fully financed by their developers in 2015 and 2014, respectively.
THE IMPORTANCE OF INTRA-REGIONAL, US AND EUROPEAN SOURCES
Intra-regional investment accounted for the largest share of investment in Climatescope countries by far between 2010 and 2015, outweighing extra-regional investment by a factor of two to one. This is mostly explained by financial institutions providing capital to projects located in the country where they are based. However, there has also been significant cross-border investment within regions, particularly Latin America.
In terms of external regions providing capital, Europe deployed the most to Climatescope countries (Figure 5), led by Italy, Spain and the United Kingdom. The US is by far the largest non-Climatescope country source of clean energy investment across all regions.
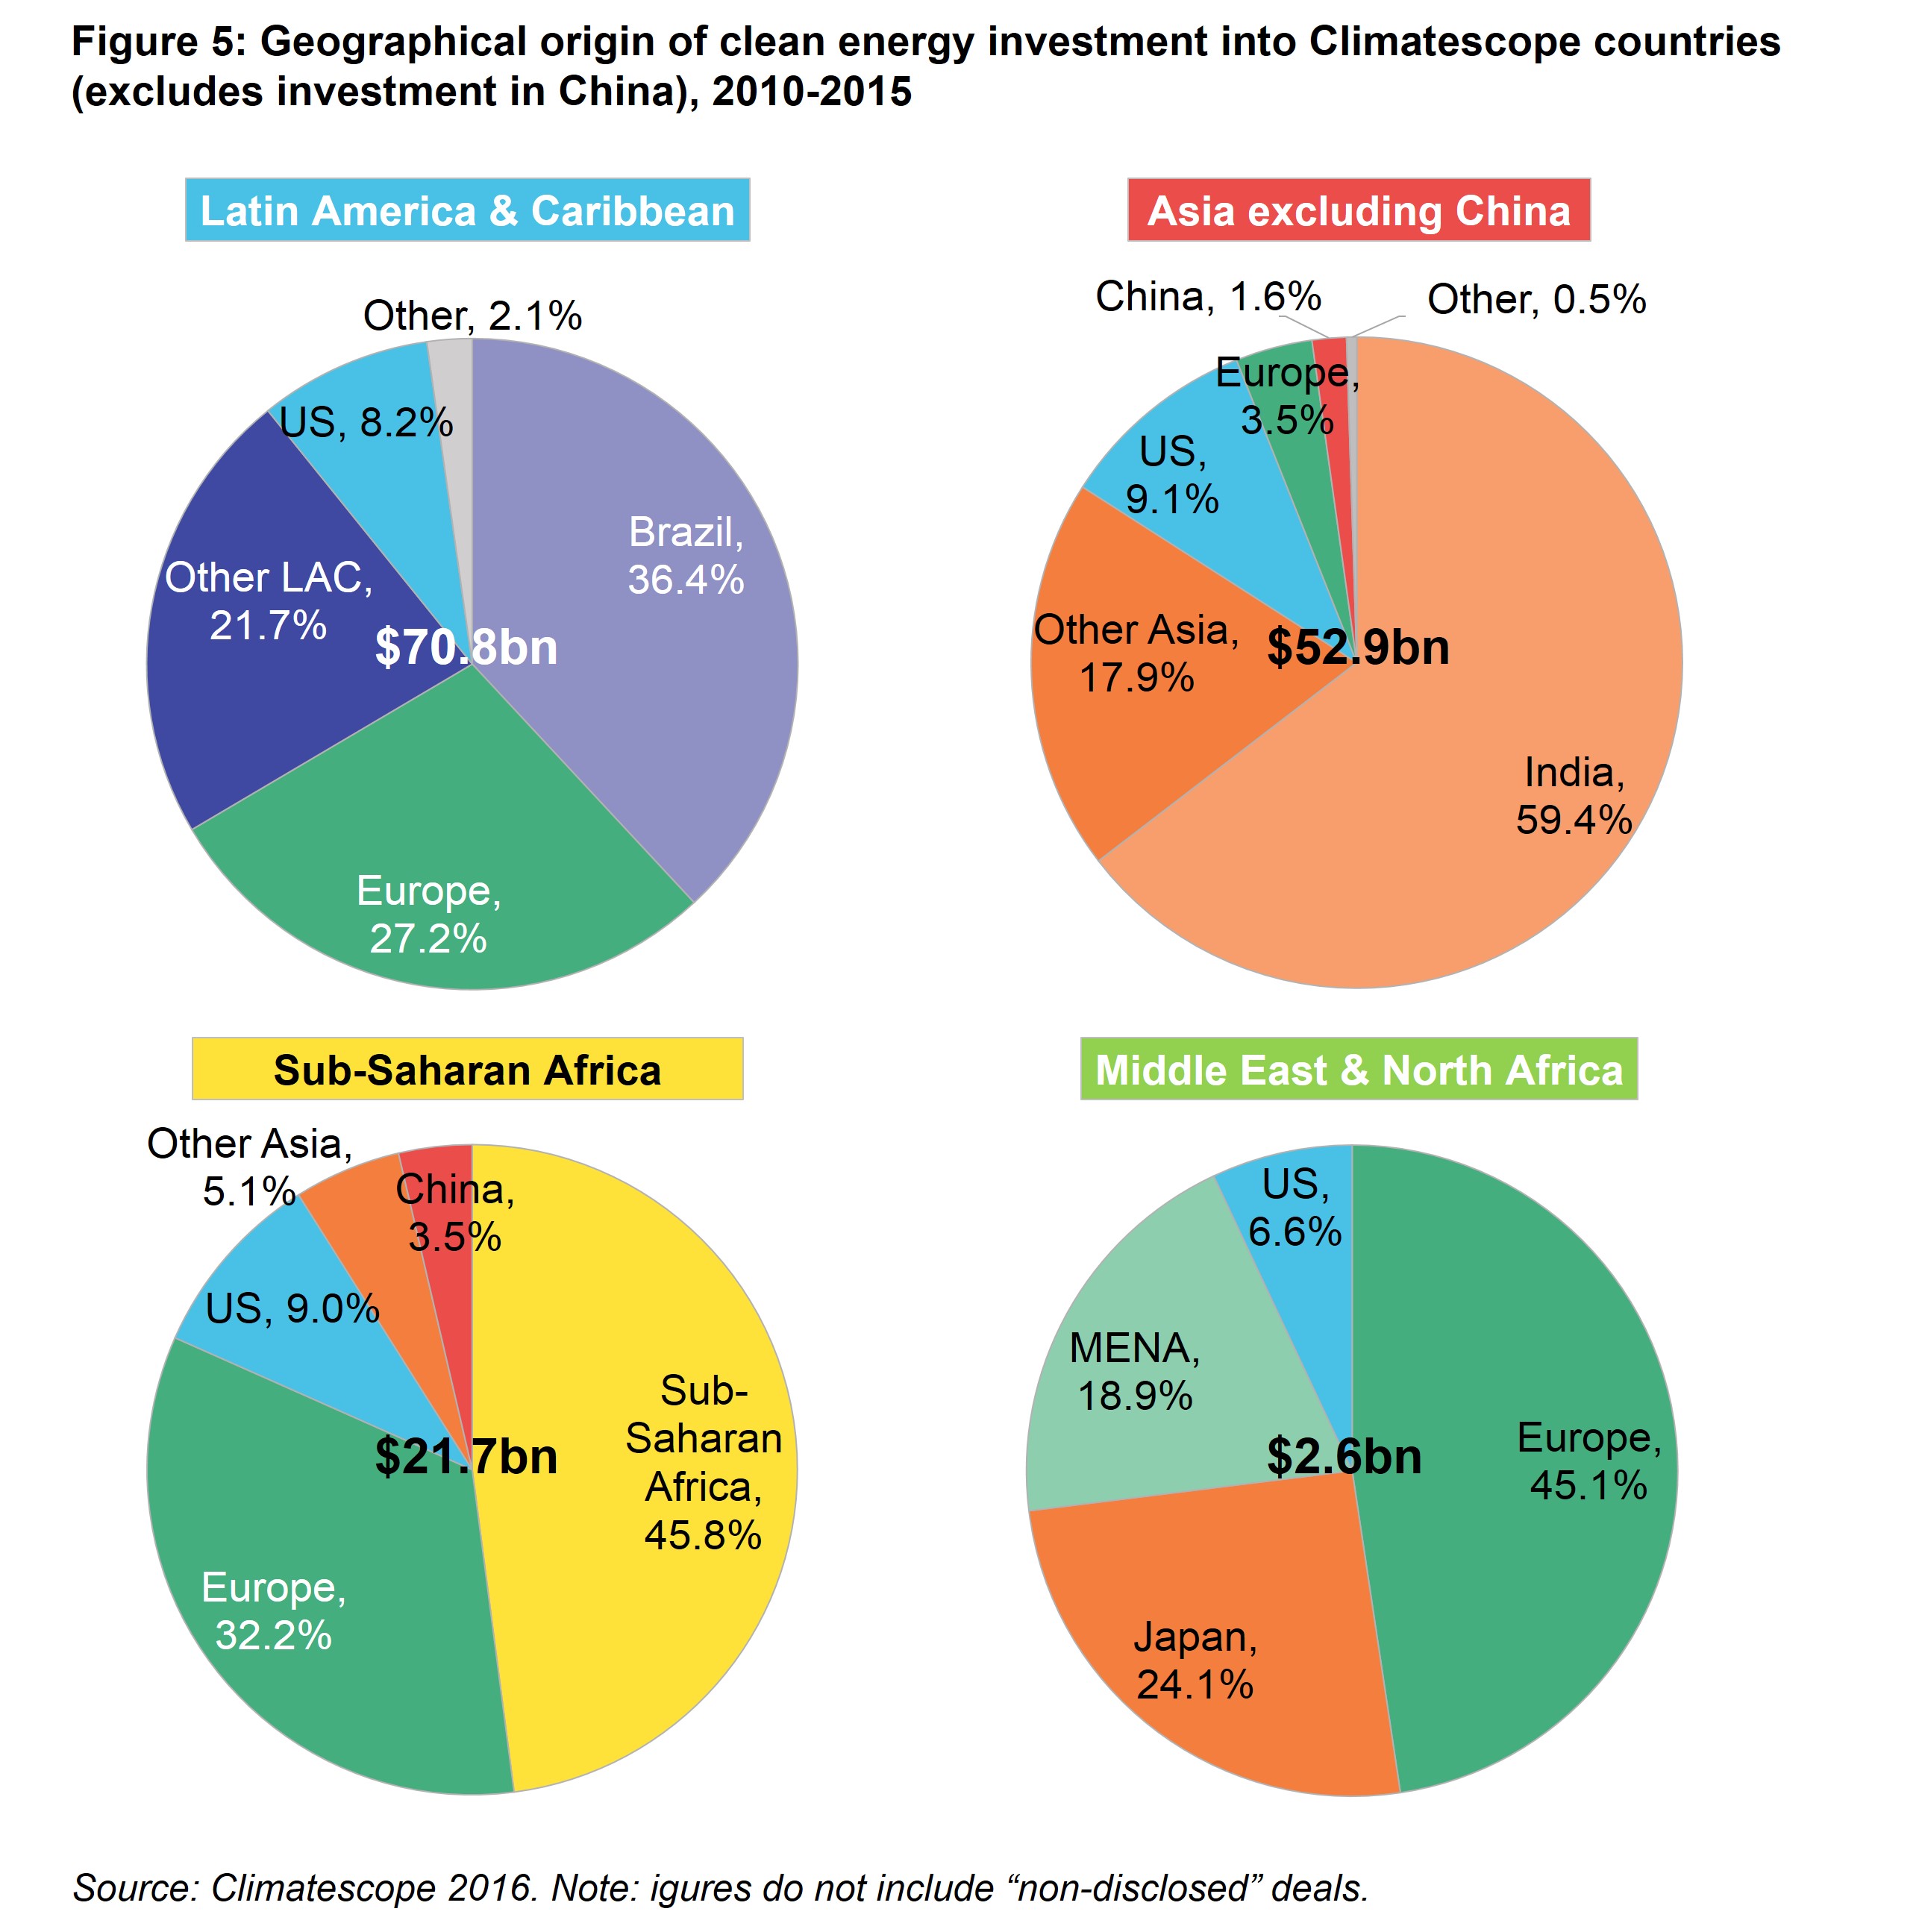
In all, $50bn of clean energy investment flowed from developed countries to Climatescope nations between 2010 and 2015. Averaged across the six years, this comes to $8.3bn. It is a far cry from the $100bn per year nations pledged to achieve by 2020 under the accord signed at Copenhagen in 2009.
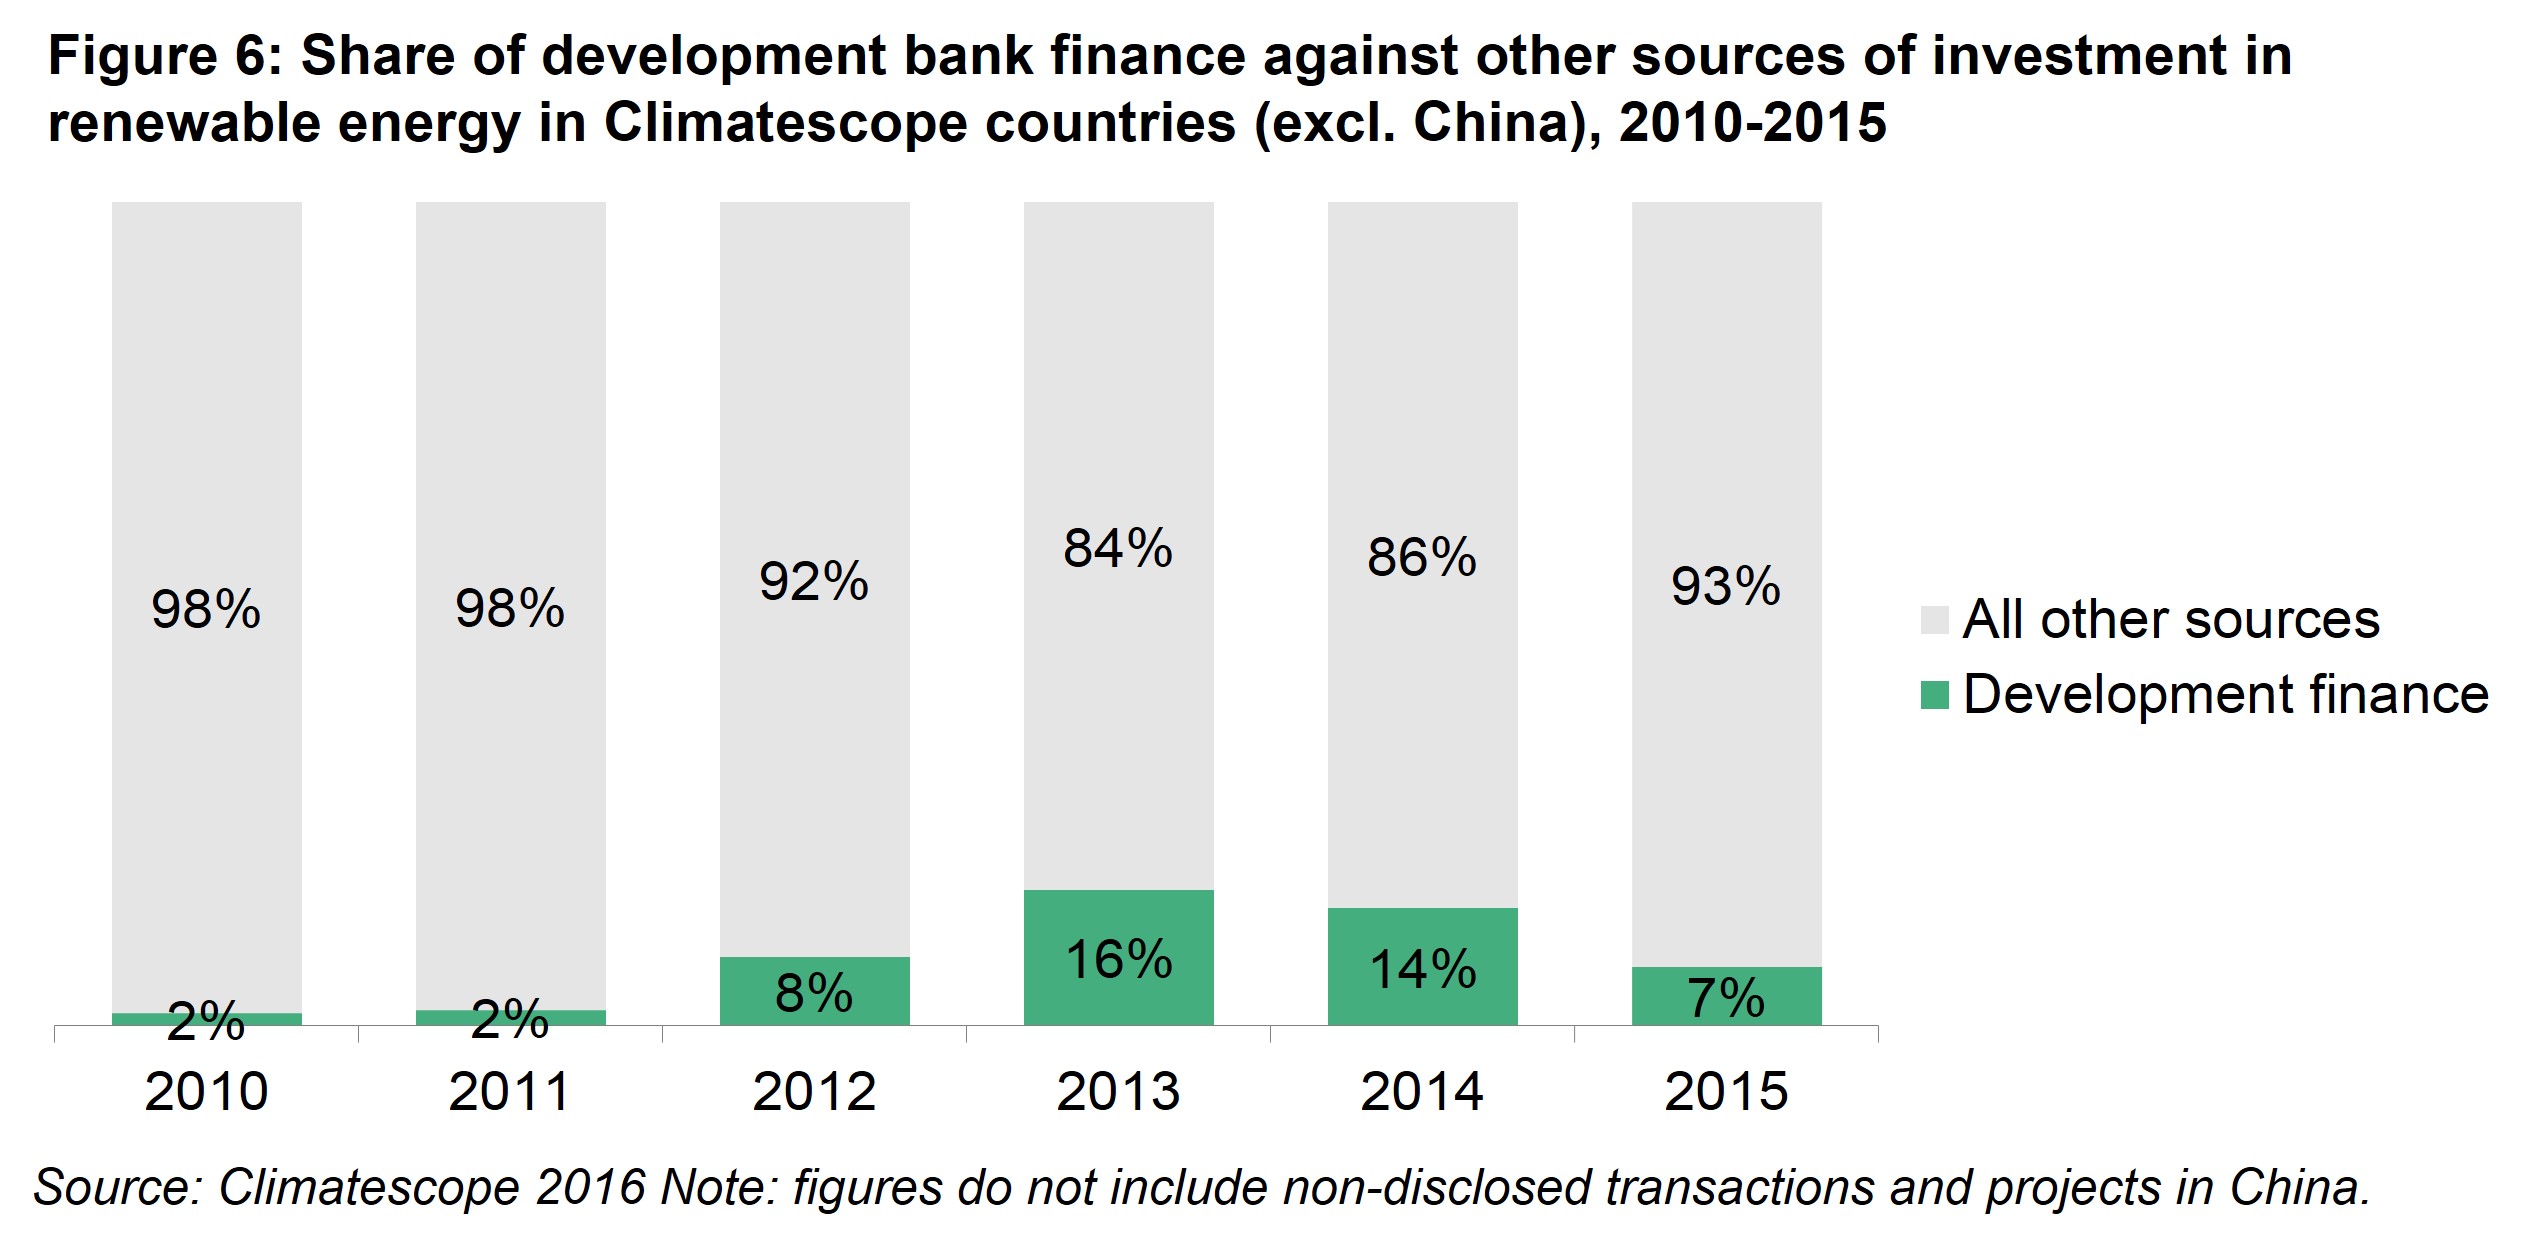
DEVELOPMENT FINANCE IS INCREASINGLY SUPPORTING CLEAN ENERGY PROJECTS
On the other hand, as discussed above, capital is coming from more heterogeneous sources and there are signs that development finance institution funds are leveraging more capital from commercial and sovereign players. The contribution of development finance in Climatescope countries increased considerably in 2012 and 2013, but it has shrunk again over 2014 and 2015 (Figure 6). However, the vast majority of development bank supported projects in Climatescope countries involved at least one other partner organization, showing the role of development institution as facilitators and attractive sources of finance (Figure 7). In the years 2011, 2012 and 2015 up to half of the projects involved development banks and at least two other organizations.
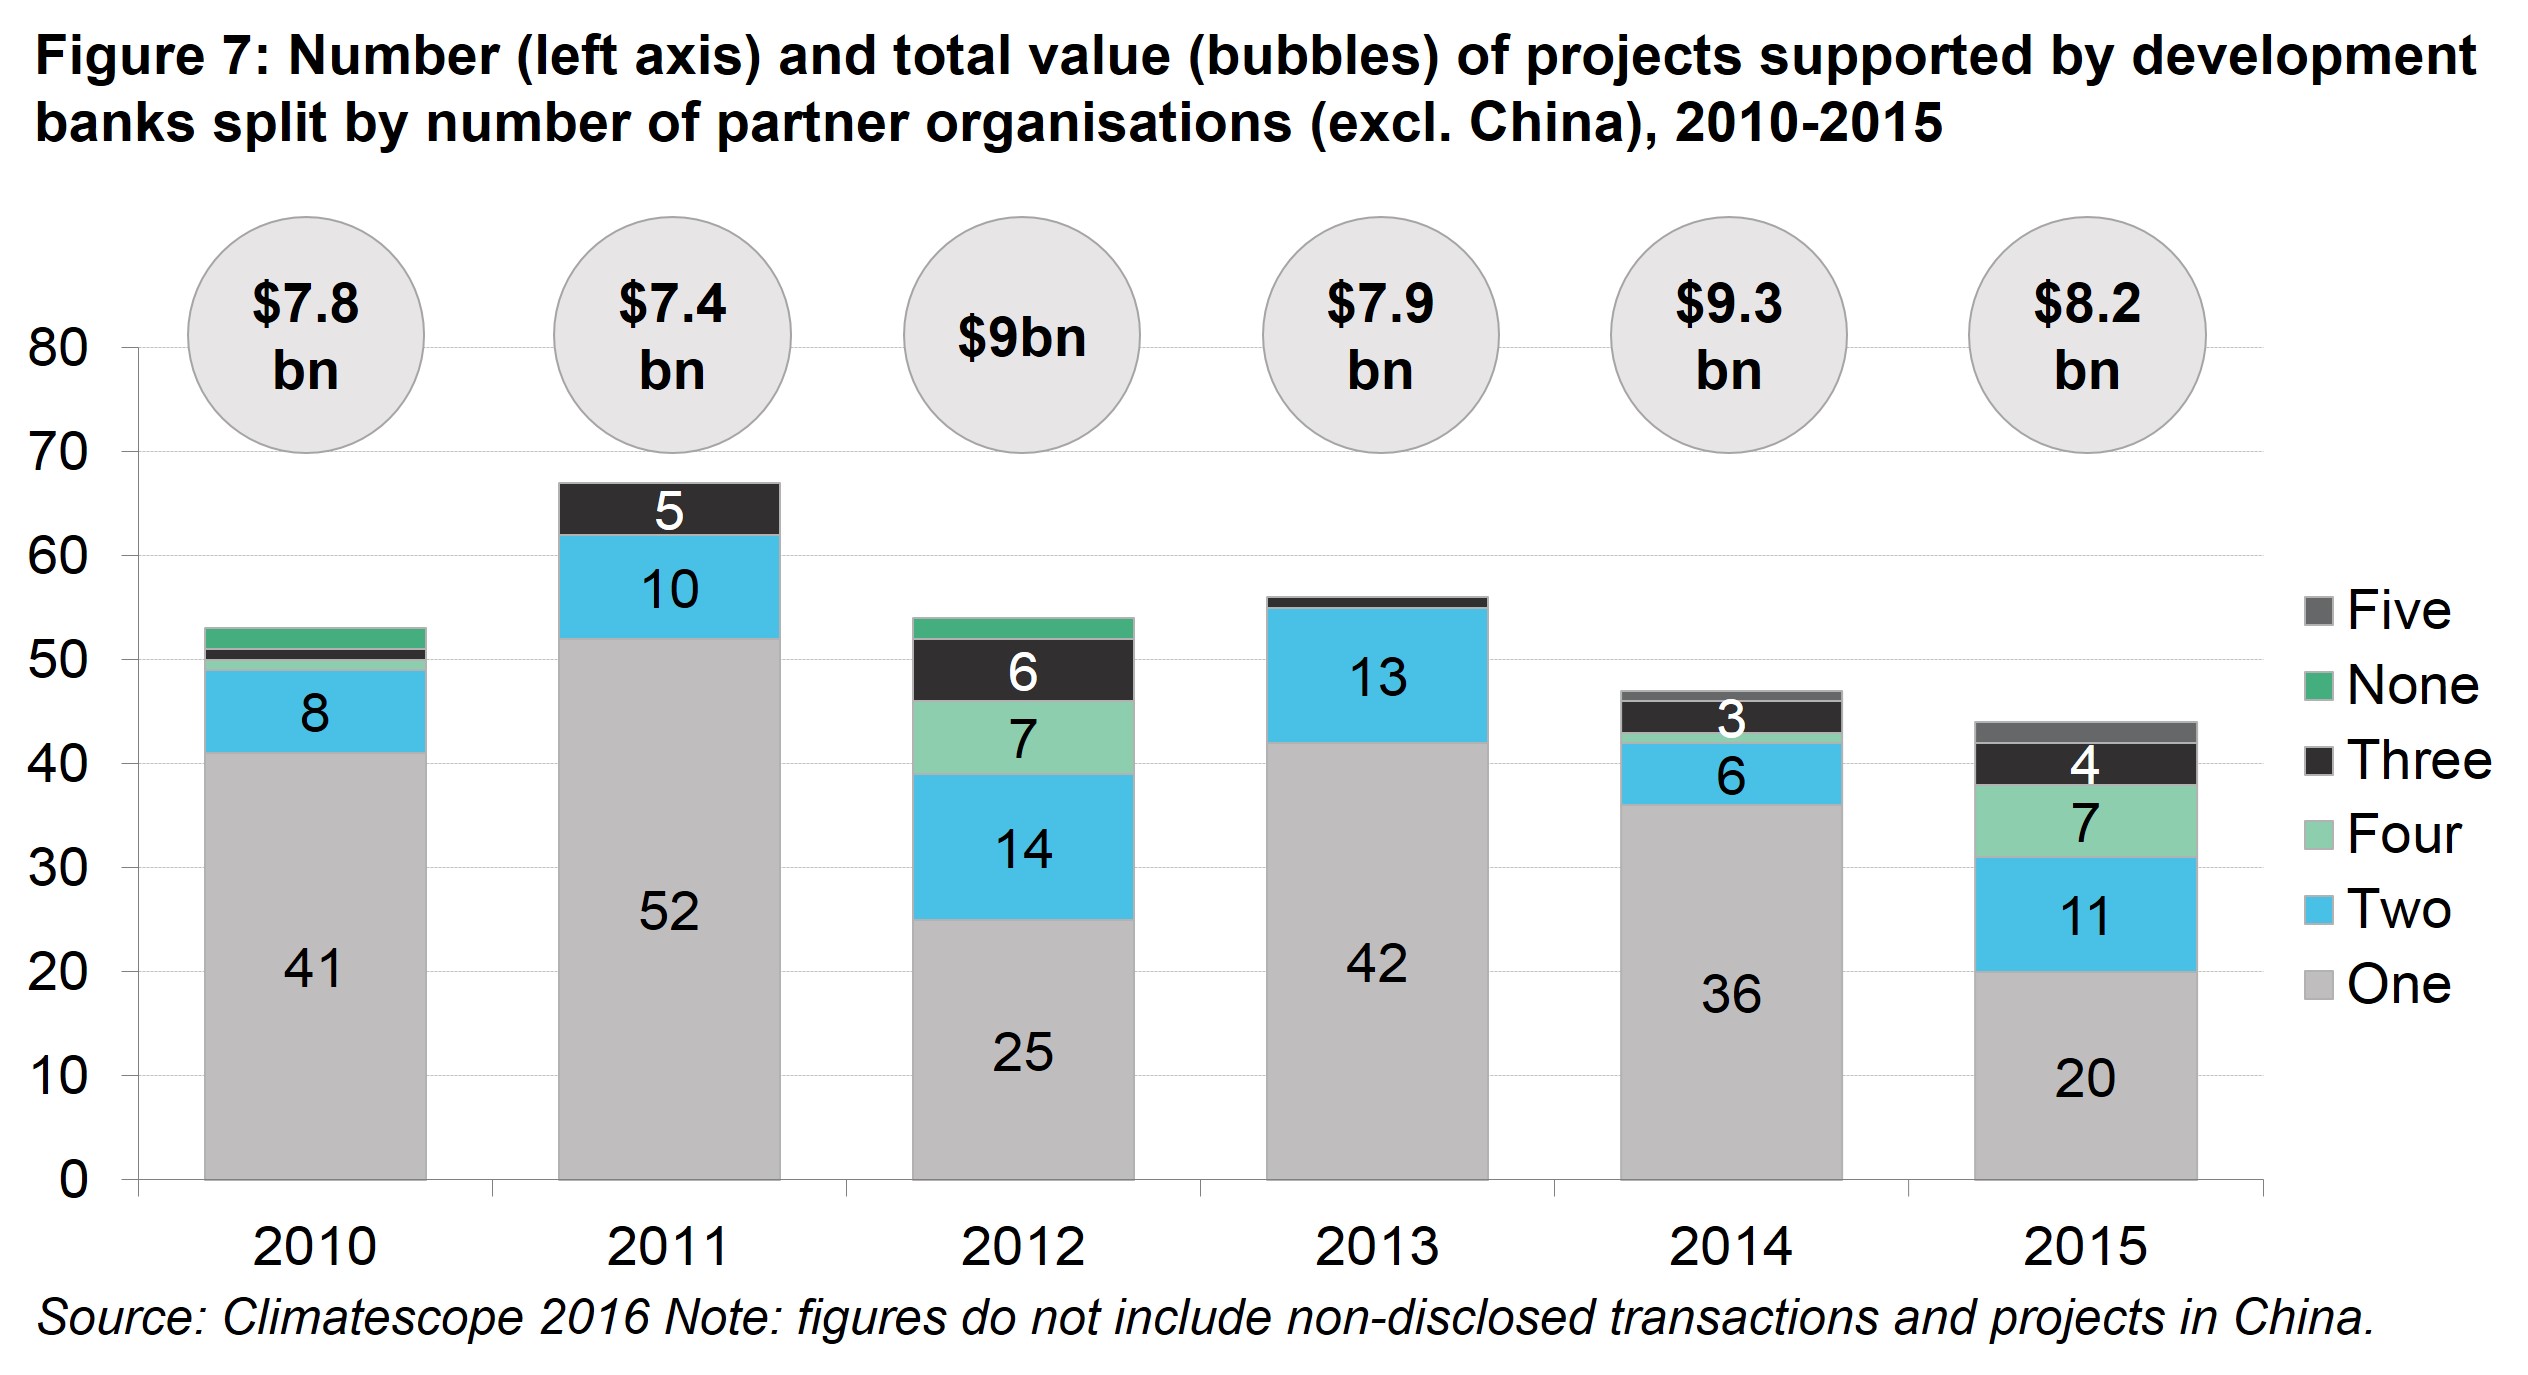
The largest investments also tend to bring together the financing and expertise of the greatest number of partner organizations alongside development banks. The Karoshoek, Xina and Kaxu concentrated solar power plants in South Africa, the Marena onshore wind project in Mexico, and the Lake Turkana onshore wind project in Kenya are each worth in excess of $800m which involved development banks and six to seven more partner organisations.
1 International Energy Agency, World Energy Investment Report, 2016. 2 China, Brazil, India, South Africa, Mexico, Chile, Indonesia, Uruguay, Peru and Kenya. 3 Bahamas, Barbados, Belize, Democratic Republic of Congo, Guyana, Haiti, Lebanon, Liberia, Tajikistan and Trinidad and Tobago. 4 $600m is the average capex of a 380MW solar plant and a 324MW onshore wind plant in the United States. 5 In Figure 4 development finance is included in the development bank category.
Regional average
- %% region.name %%
- %% region.parameters[0].data[0].mean | round:2 %%
| Topic rank | Country | Topic score | Trend | 0.0 - 5.0 Average: %% countryTable.scoreAvg | round:2 %% | Grid |
|---|---|---|---|---|---|
| %% country.data[0].overall_ranking | leadingZero:2 %% | %% country.name %% States | %% country.data[0].value | thousands:2 %% |
|
%% country.grid %% |