Value chains
Topic
PARAMETER III – VALUE CHAINS
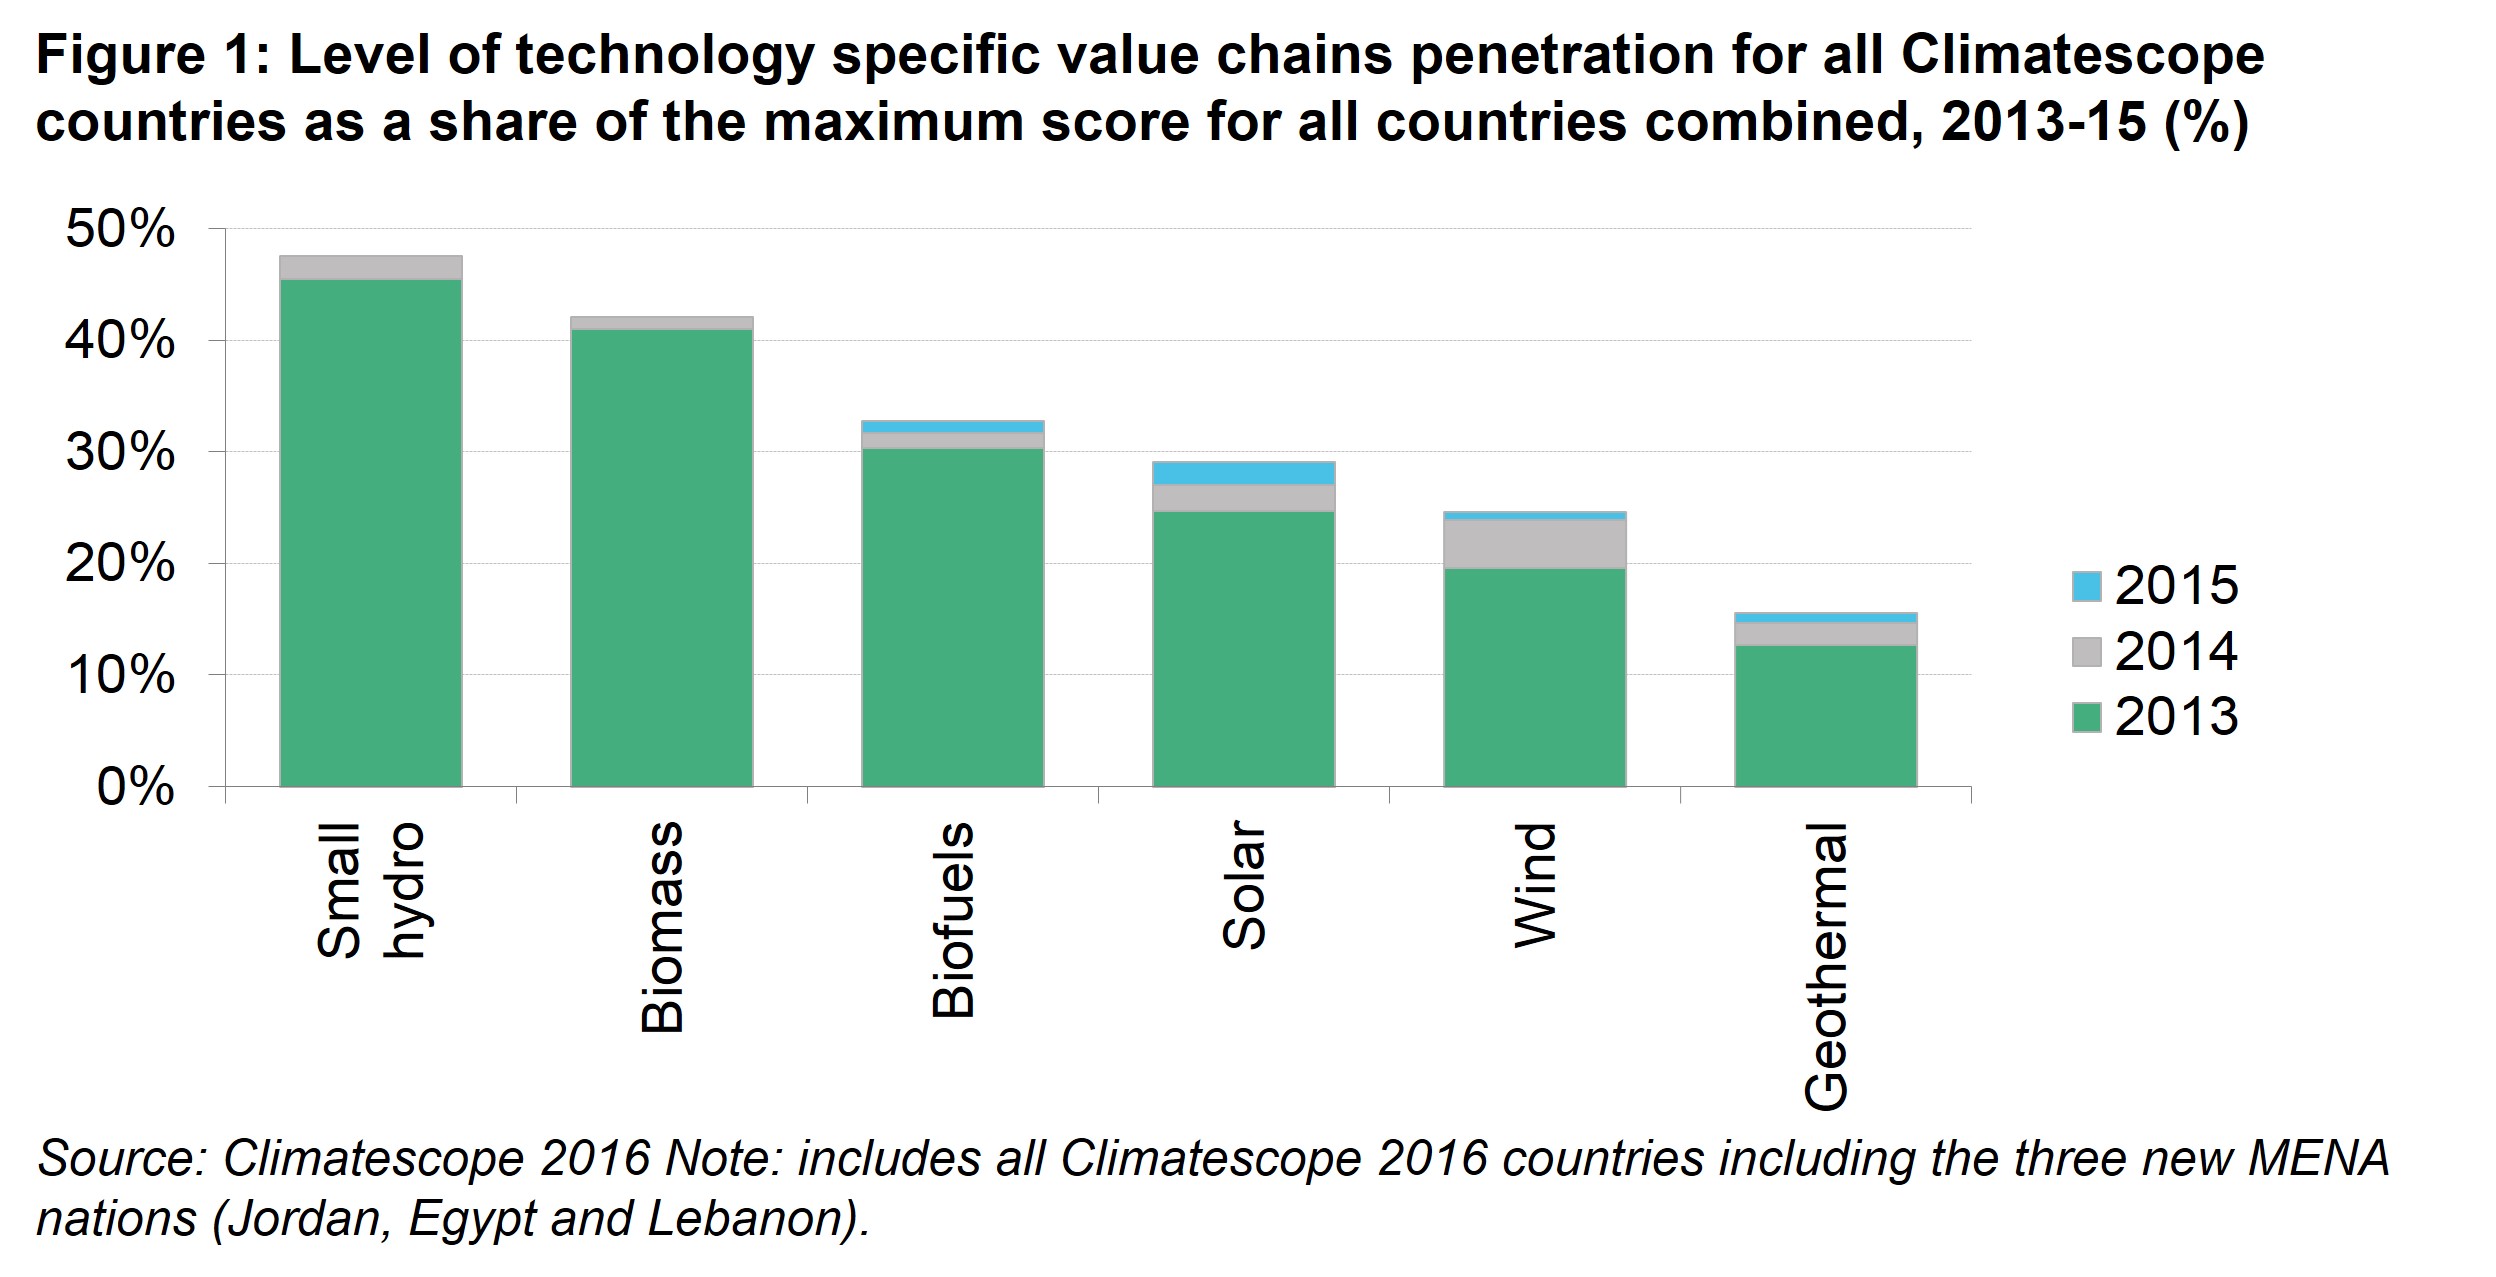
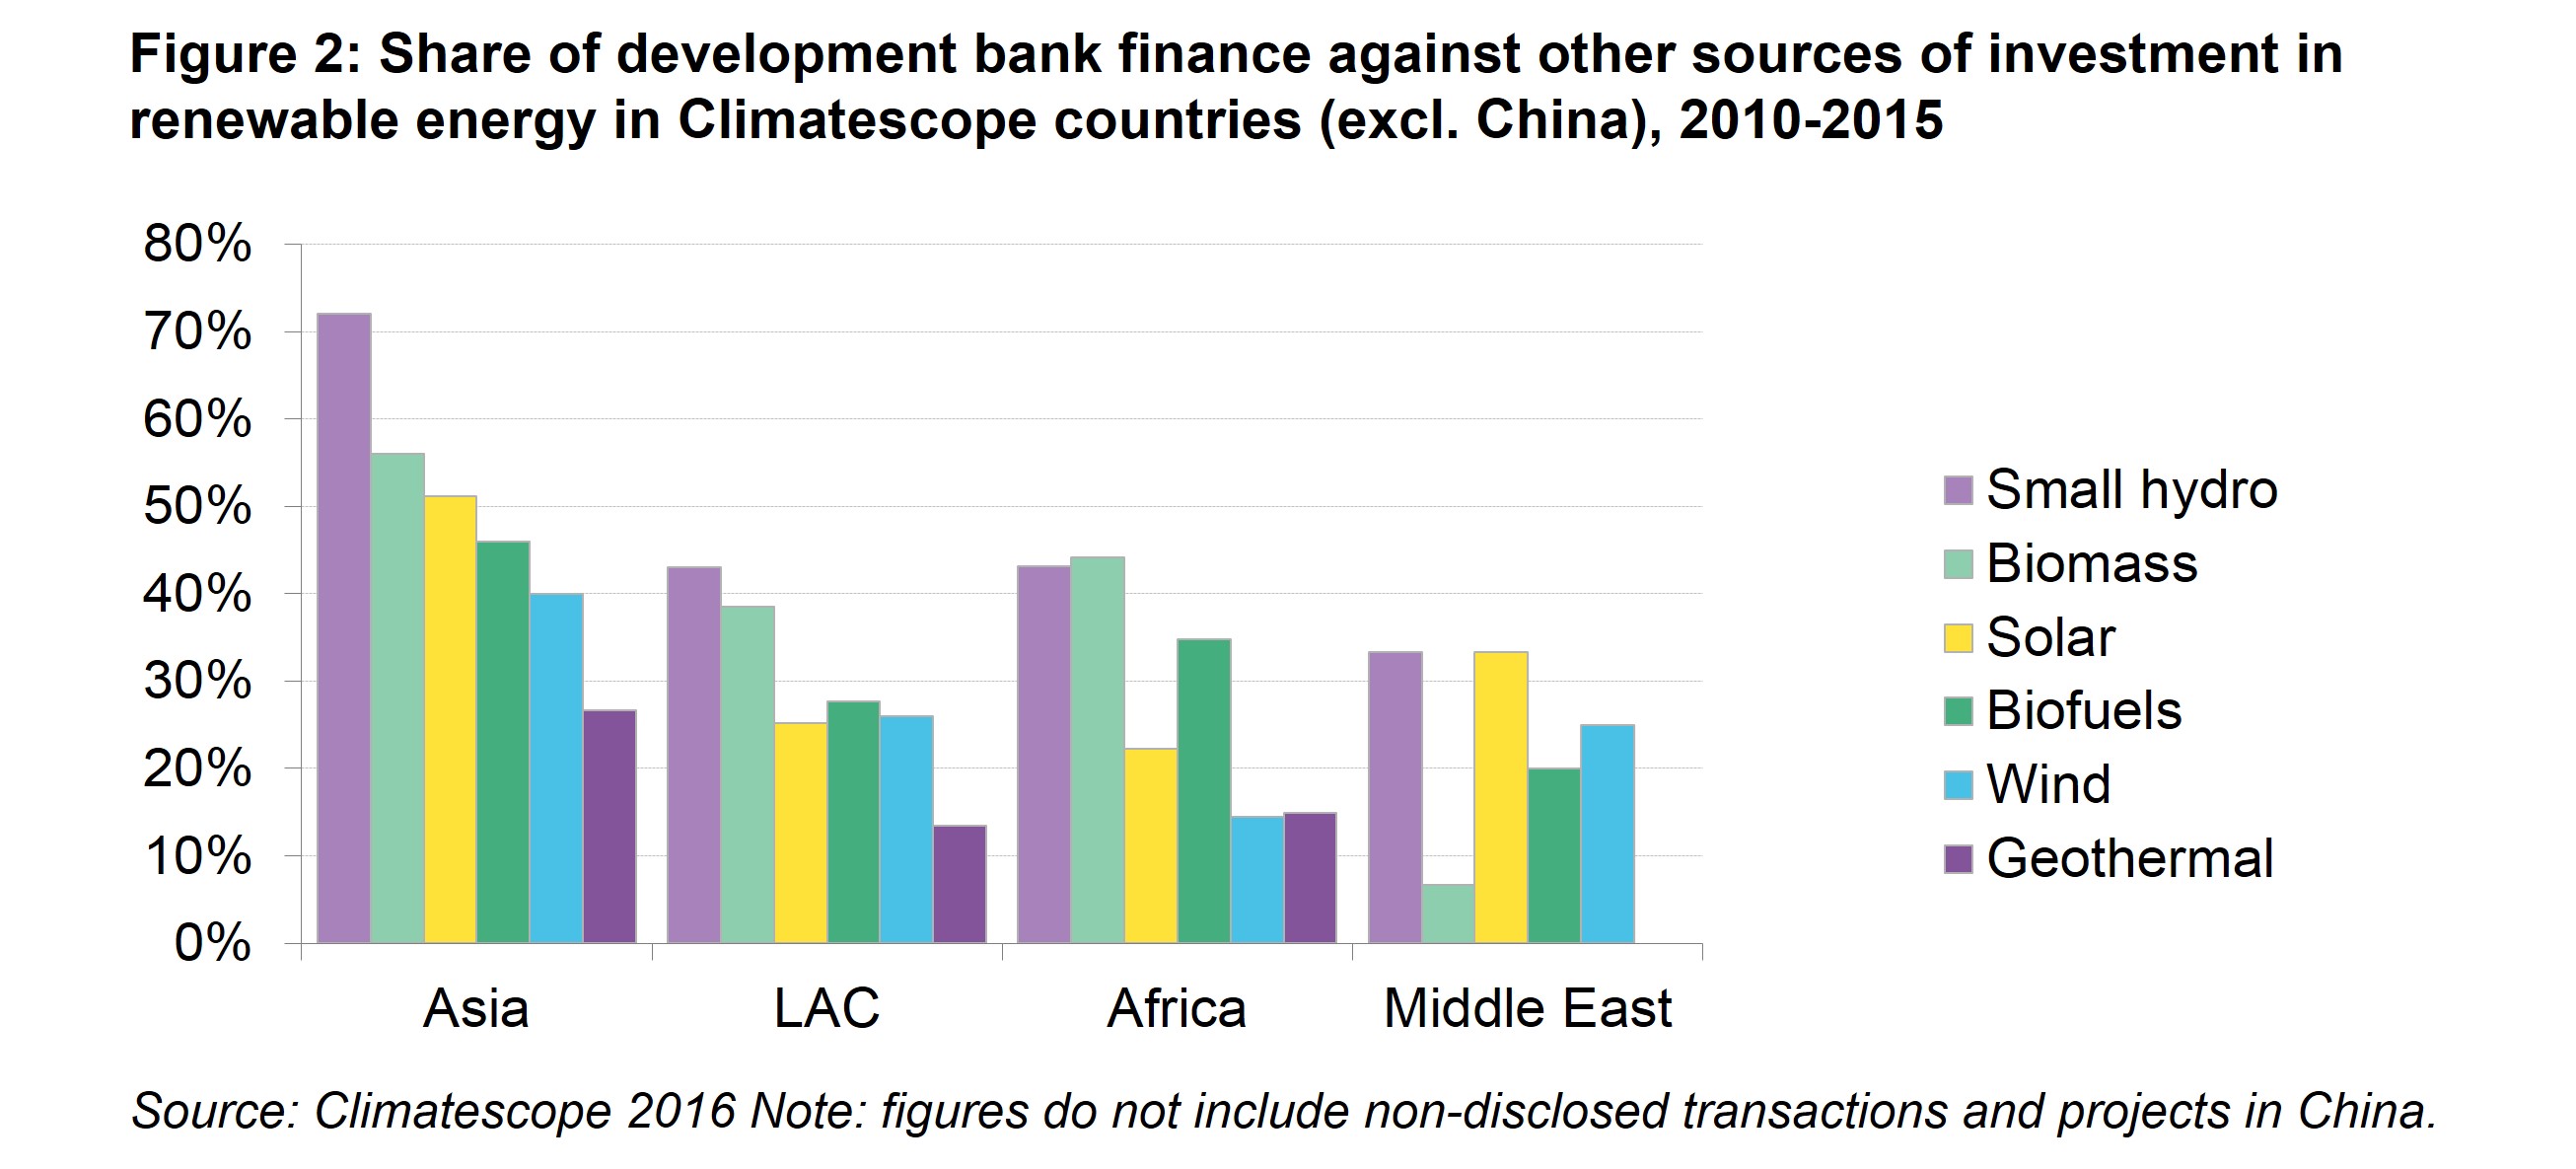
This parameter employs three indicators to measure local value chain resources available to facilitate clean energy deployment. These seek to take into account the availability of local manufacturers to provide the equipment needed to construct technology-specific projects (Figure 1 and Figure 2), financial firms to provide capital, and service firms to provide assistance such as legal support.
For the nations with the least developed power systems in the survey categorised as “off-grid” (see methodology for more details]), this parameter includes two additional off-grid indicators , which take into account the availability of technical assistance and service providers in value chains specifically related to distributed clean energy. In all, Climatescope sought to account for no less than 63 value chain segments for the on-grid nations and 78 for those in the off-grid category. Parameter III contributed 15% toward each nation’s overall score.
It is important to note that Parameter III measures the presence and absence of specific value chain segments. It does not take into account the volume of actual output occurring locally.
KEY FINDINGS
Climatescope 2016 confirmed that expanding manufacturing chains in the survey’s nations is a slow and laborious process. The average score among all Climatescope nations on Parameter III inched up to 1.98 from 1.96 in last year’s study and 1.94 the year prior. Of the 24 nations that managed to raise their Parameter III scores, half added just a single link to their local value chains.
TECHNOLOGY TRENDS
Progress on value chains in 2014 and 2015 combined has been the strongest in the technology-specific sub-indicators for wind, solar and geothermal (Figure 1). Wind and solar have by far been the most dynamic technologies in terms of new investment (see Parameter II summary). The spread and coverage of the geothermal value chain is the lowest of all clean energy technologies. This is linked to the fact that accessible resources are spread less evenly than for other renewables and that the upfront cost of developing the sector is higher.
From a regional perspective, Asia scores highest across all renewable energy technology value chains (Figure 2). This is not just due to its two giants, China and India, but would also be true if they weren’t included. Africa and, Latin America and the Caribbean have similar scores overall, although Brazil is contributing to the latter’s strong performance on wind. Brazil, Chile, Kenya, Mexico, South Africa and Uganda are the only countries in these two regions scoring higher than three in the value chain parameter. The Middle-East region scores lowest overall. This is explained in part by a small sample of just three countries (Egypt, Lebanon and Jordan) and the moderate activity in the region to date. That said, Jordan is driving the region’s performance on solar and all three countries score well on the presence of financial and services firms.
VALUE CHAIN SCORES AND INVESTMENT
As in prior years, China has once again achieved a “perfect” value chain score of 5.0, but India and South Africa are continuing to close the gap with scores of 4.42 and 4.41 respectively. These countries and Brazil, which saw its score rise to 4.35, are also topping the clean energy investment (Parameter II) and capacity addition tables (Parameter I).
The countries which perform the best on Parameter III also tend to be those with the largest economies. Two thirds of the 15 countries with the largest GDPs are amongst the top 15 in terms of value chain scores.
There are some notable exceptions, however. Colombia, Peru, Venezuela, Egypt, Nigeria and Argentina all have low value chain scores relative to the sizes of their economy. In fact, they have some of the lowest levels of investment in clean energy per unit of GDP. This is primarily due to the the lack of an enabling environment for renewable energy. Peru is an interesting outlier among this group. It has seen substantial clean energy capacity additions (Parameter I) over the last decade, but 70% of this has been concentrated solely on the technology of small hydro. As a result, it has yet to build out significant value chains for other technologies.
Uruguay, Honduras and Nicaragua are amongst those that have seen the highest level of investment in clean energy per unit of GDP without developing strong local value chains. This can be explained by the small sizes of their economies and their proximity to other, supplier nations.
Climatescope also allows us to explore the relationship between the frequency of investment and the development of a domestic value chain. Figure 3 shows the average value chain score of Climatescope countries divided into groups according to the frequency of clean energy investment over the 2006 to 2015 period. More recurrent clean energy investment has a clear positive relationship with value chain scores. This is an important factor to take into account in setting government plans for clean energy deployment.
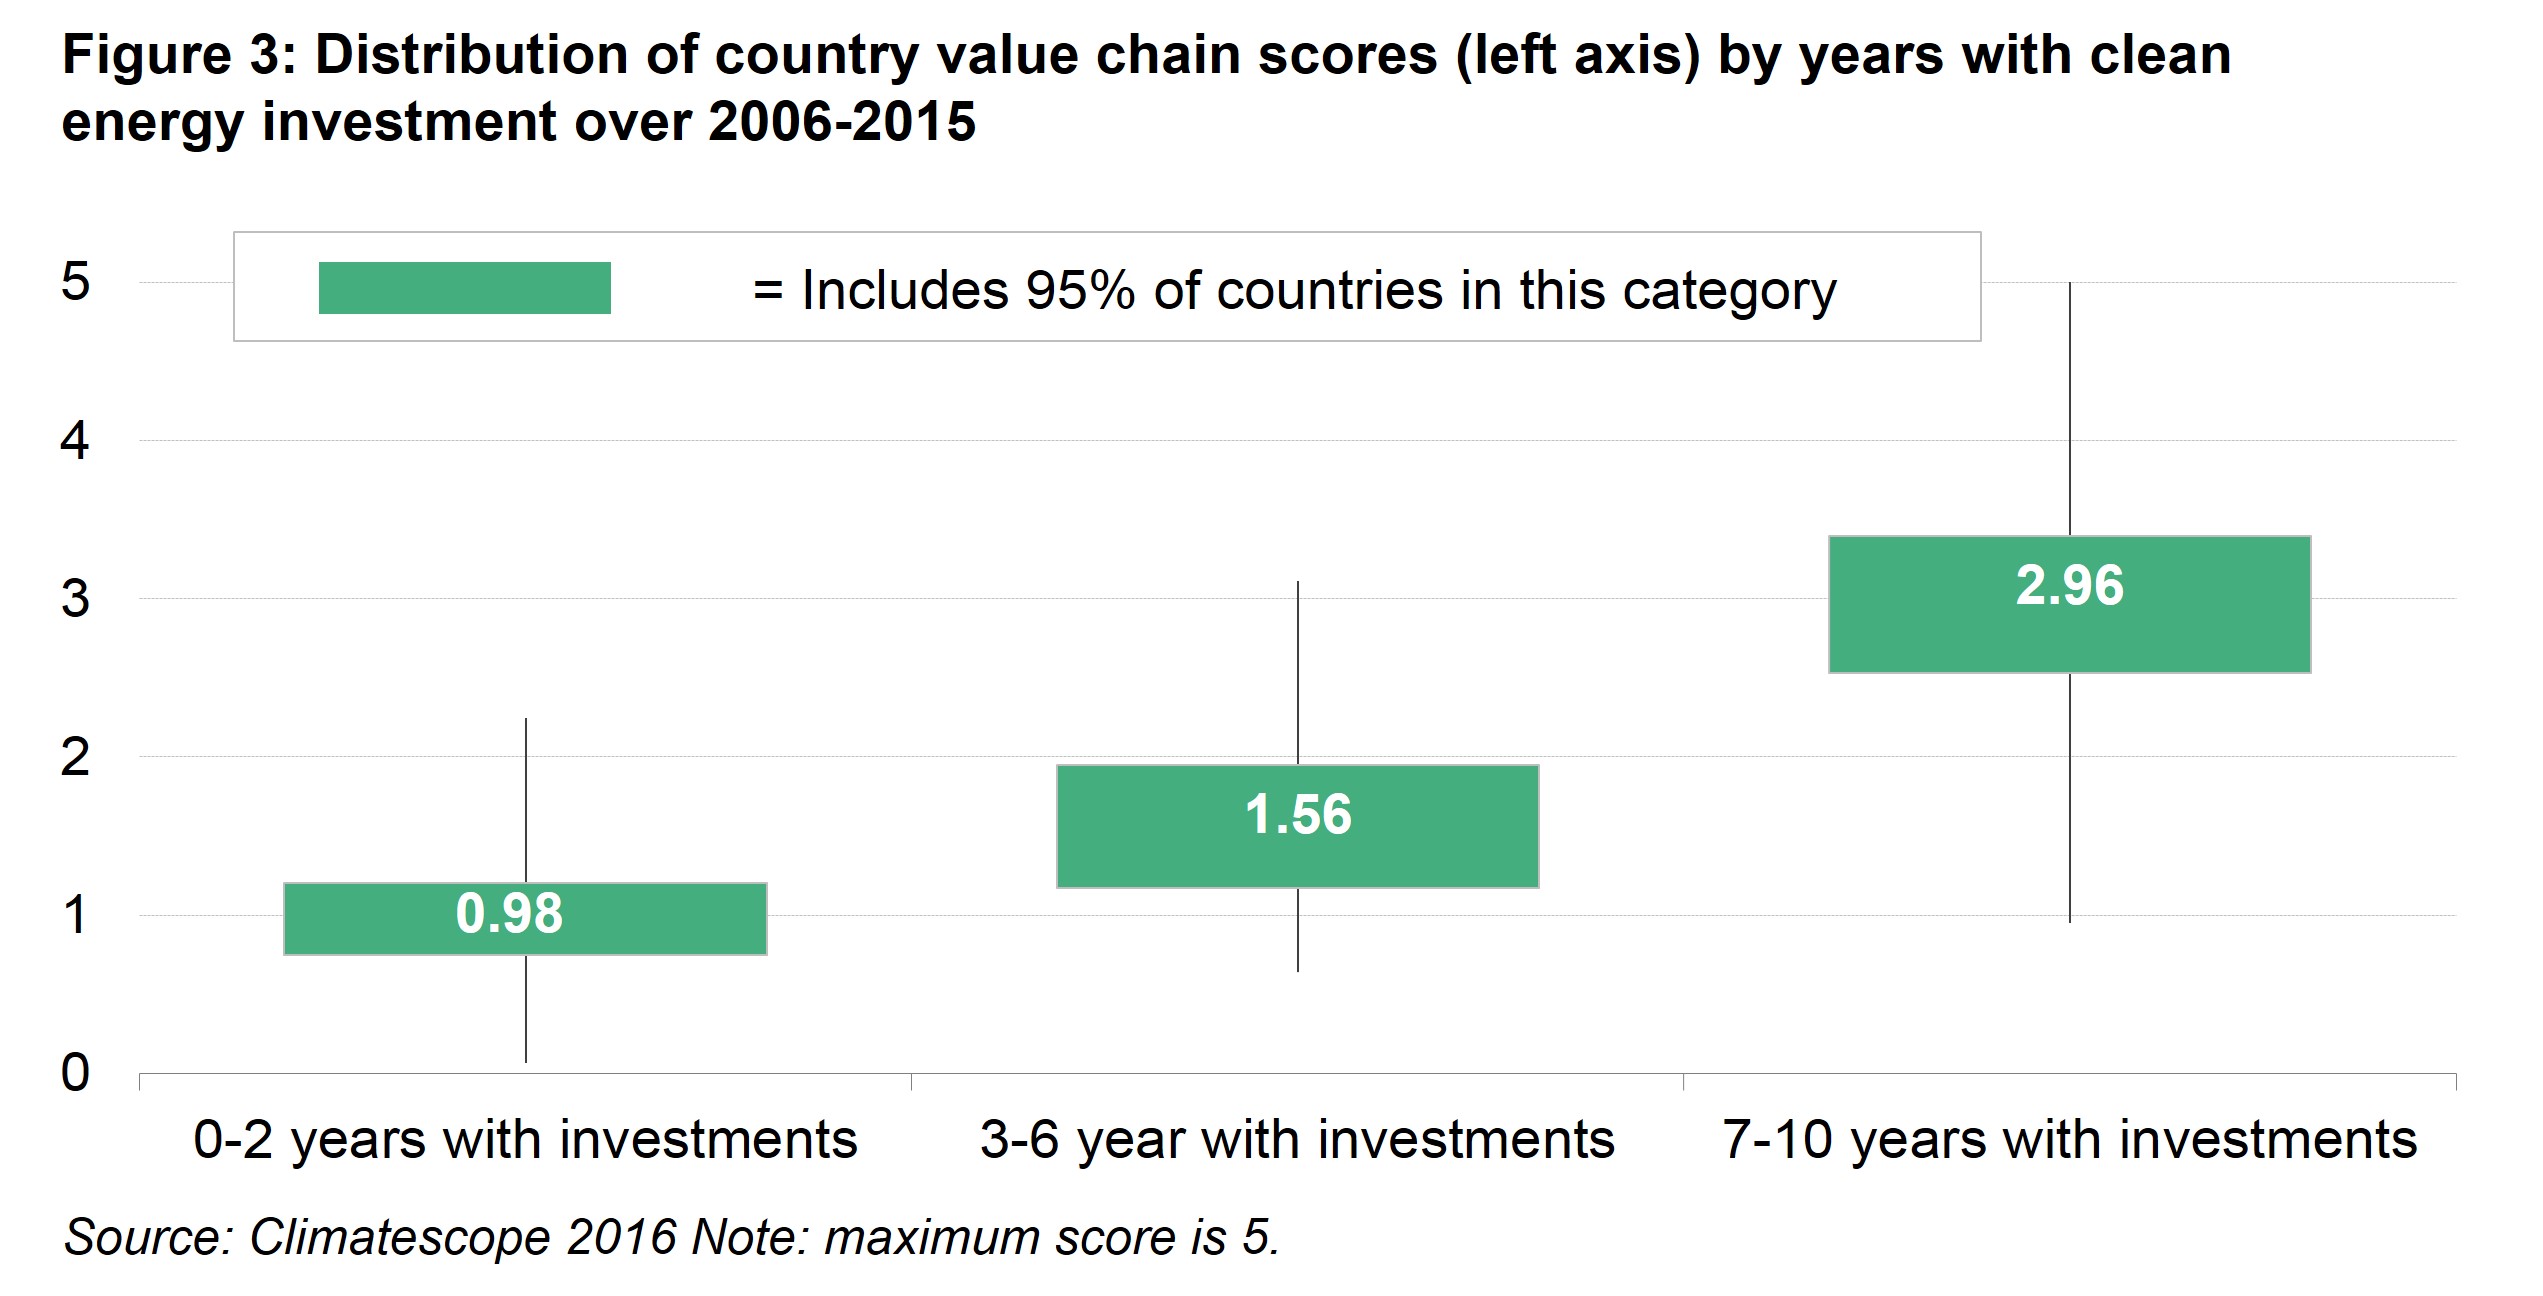
A country that has the ambition to develop its domestic clean energy manufacturing industry may design its targets and support mechanisms so as to ensure that activity is spread evenly or incrementally across years. This could provide the regularity and predictability needed for the renewables sector to thrive. In this respect, auction policies are a particularly powerful tool. Manufacturers and suppliers that are given medium- to long-term certainty over annual auctioned capacity are more likely to develop a local supply base. India, South Africa or Brazil are good examples of markets where the frequency of auctions combined with local content rules have led to a strengthening of the domestic manufacturing and service base.
Regional average
- %% region.name %%
- %% region.parameters[0].data[0].mean | round:2 %%
| Topic rank | Country | Topic score | Trend | 0.0 - 5.0 Average: %% countryTable.scoreAvg | round:2 %% | Grid |
|---|---|---|---|---|---|
| %% country.data[0].overall_ranking | leadingZero:2 %% | %% country.name %% States | %% country.data[0].value | thousands:2 %% |
|
%% country.grid %% |