Key Findings
EXECUTIVE SUMMARY
Welcome to Climatescope, an assessment of clean energy market conditions and opportunities in 58 emerging nations in South America, Africa, the Mideast, and Asia. This third global release of the project takes into account the extraordinary 12 months of clean energy investment, construction, and policy-making of 2015. It also contextualizes that progress against activity in other, wealthier nations. As in years past, Climatescope scores countries based on their levels of activity and the environments they create to attract further clean energy investment.
- The center of the clean energy universe has now shifted decisively from “north” to “south”. Compared to wealthier Organisation for Economic Co-operation and Development (OECD) countries, the Climatescope nations in 2015 cumulatively attracted more investment ($154.1bn vs. $153.7bn) and saw far more clean energy capacity build (69.8GW vs. 59.2GW). China was a large part of this, but lesser developed nations also played a role. Year-on-year, investment growth and deployment growth rates were also far higher in Climatescope nations than in OECD countries.
- Steep solar equipment cost declines are catalyzing build and driving growth. Investment in utility-scale solar in Climatescope nations spiked 43% from 2014 to $71.8bn in 2015. Total clean energy investment in Climatescope countries rose $24.8bn with solar accounting for nearly all of that. Photovoltaic (PV) costs are essentially on par with wind and, as recent tenders for power contracts have demonstrated, PV can now out-compete fossil-fuelled projects on price.
- Equipment cost declines, most notably for solar, along with innovative business and financing models are revolutionizing how energy access issues are being addressed in least developed nations. No less than 1.2bn people continue to lack sufficient access to energy, but conventional hub-and-spoke responses to this problem are being challenged by a slew of new players focused on “off-grid” or “mini-grid” solutions. Many are privately-funded start-ups who between them had raised over $450m cumulatively through 2015.
- Spurred by the Paris global climate pact, an unprecedented four out of five Climatescope nations now have national clean energy targets while three in four have set CO2 emissions reduction goals. That’s up from 58% and 22%, respectively in 2014. The UN-organized climate talks galvanized countries to act. However, many now lack specific policy mechanisms to achieve their goals.
- Wealthier nations are accelerating their funding for clean energy in emerging markets. Private investors, lenders, and development finance institutions in OECD countries accounted for nearly half of all capital to Climatescope countries (excluding China, where virtually all capital was provided locally). This is up from the roughly one third of capital provided in 2012.
- Climatescope countries which have seen the highest rates of clean energy penetration are now beginning to encounter integration challenges. In some nations, wind or solar projects have been completely built – without any associated transmission to deliver power. In others, grid operators have prioritized delivery of electrons from fossil-fuelled plants over those from renewables projects.
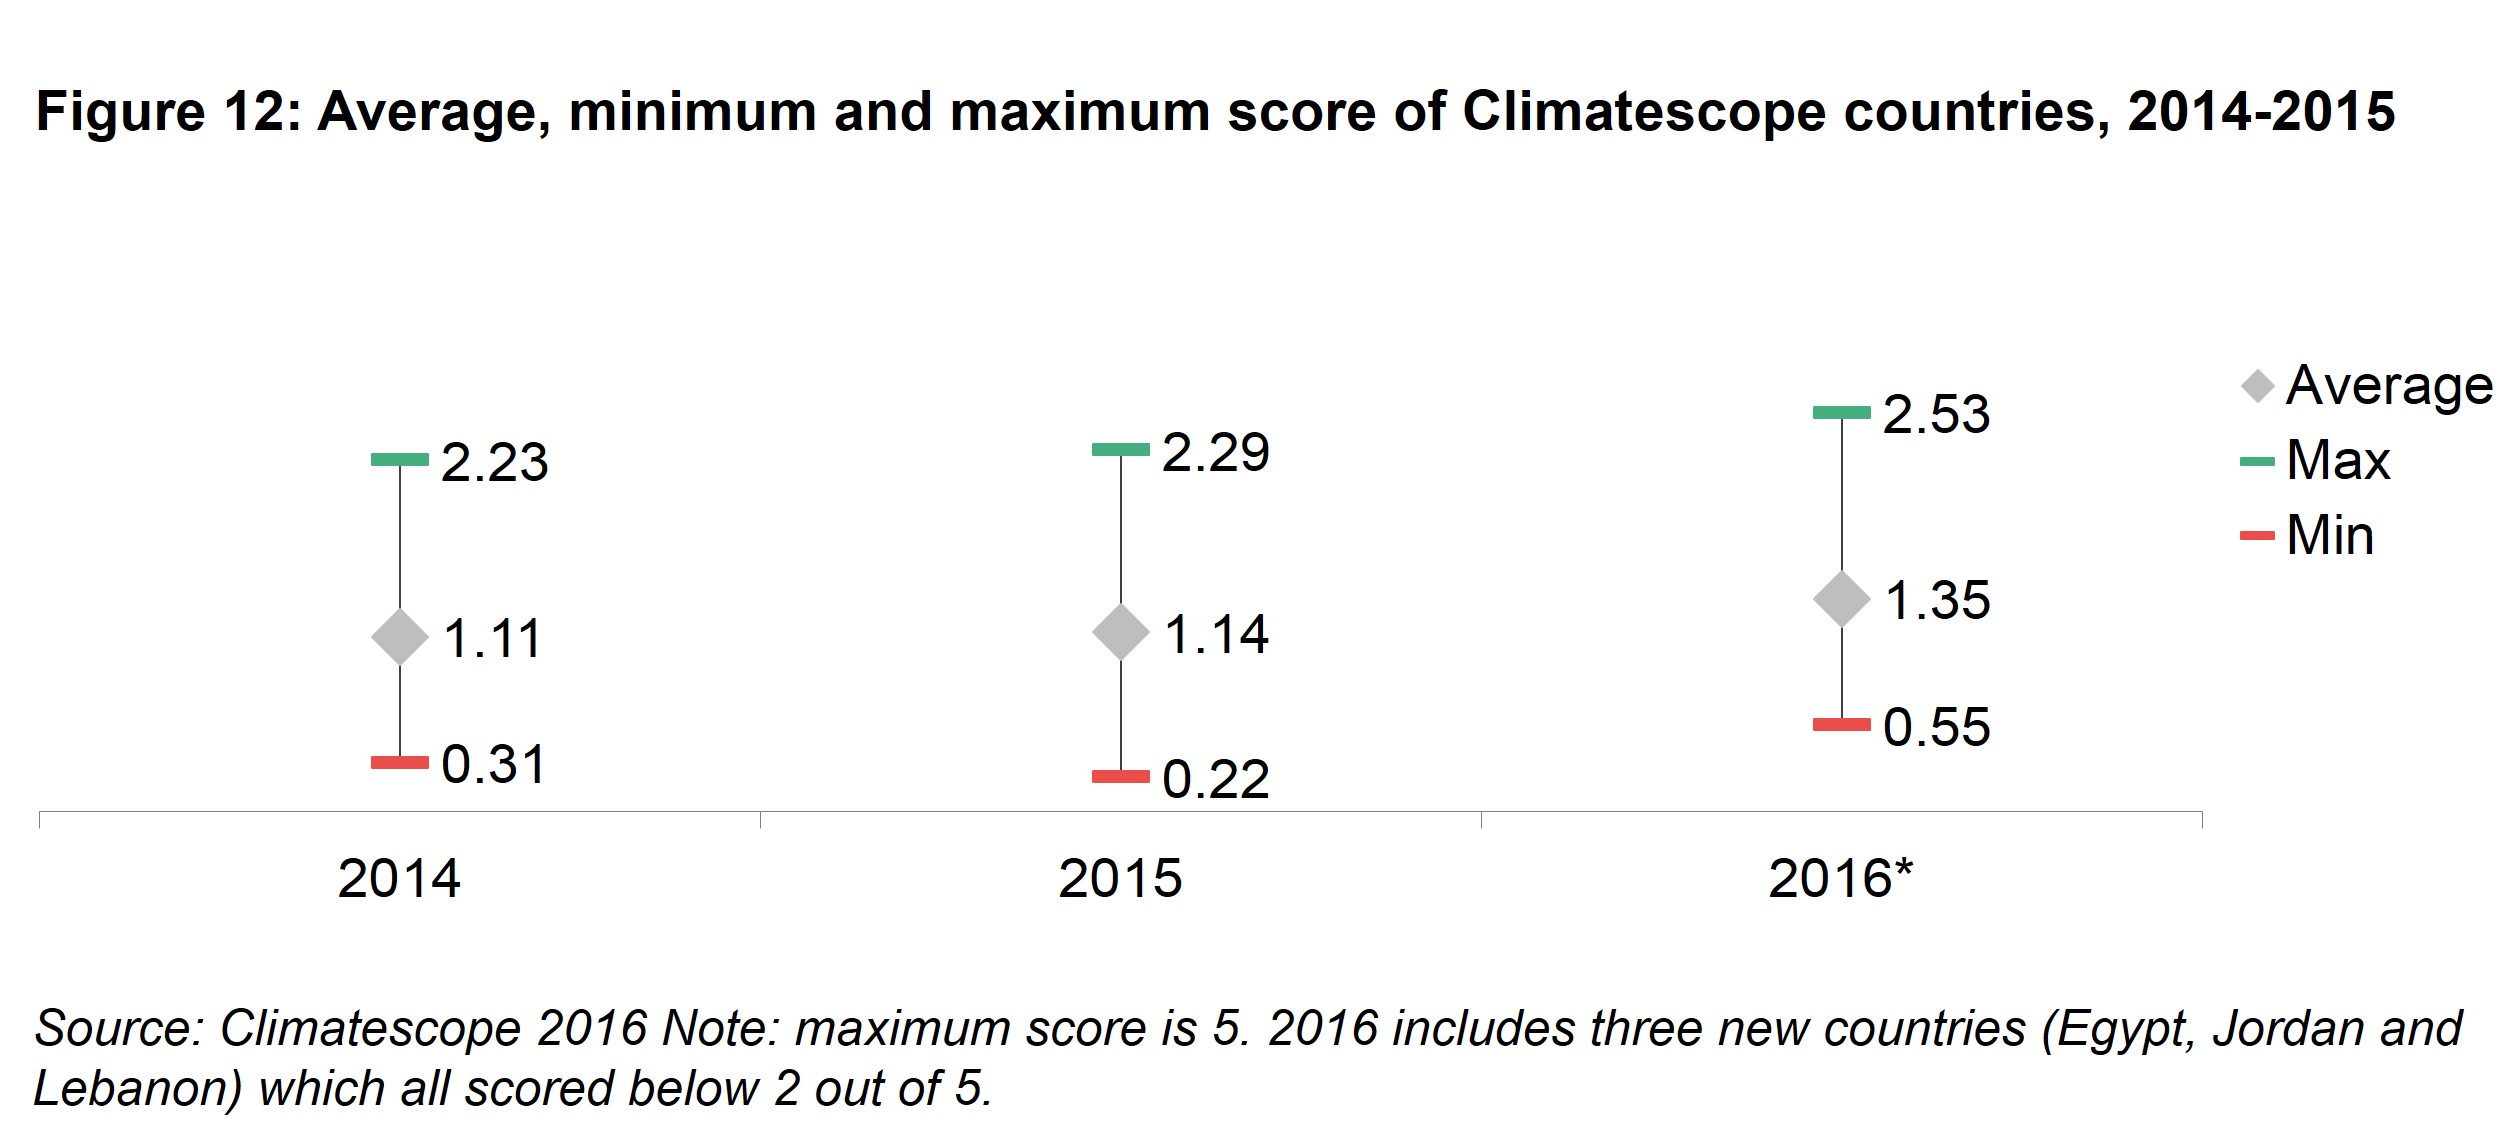
- These improving conditions are reflected in the higher Climatescope scores achieved by the majority of countries surveyed. The average score across all countries reviewed in the project rose from 1.14 to 1.35 (on a 0-5 scale) while the number of countries scoring above 2 jumped from two to 10. China once again topped the list of all countries. Chile, Honduras, Kenya, Mexico and Uruguay are the top scorers that recorded the most improvement.
KEY FINDINGS
THE CENTER OF THE CLEAN ENERGY UNIVERSE HAS SHIFTED DECISIVELY FROM “NORTH” TO “SOUTH”
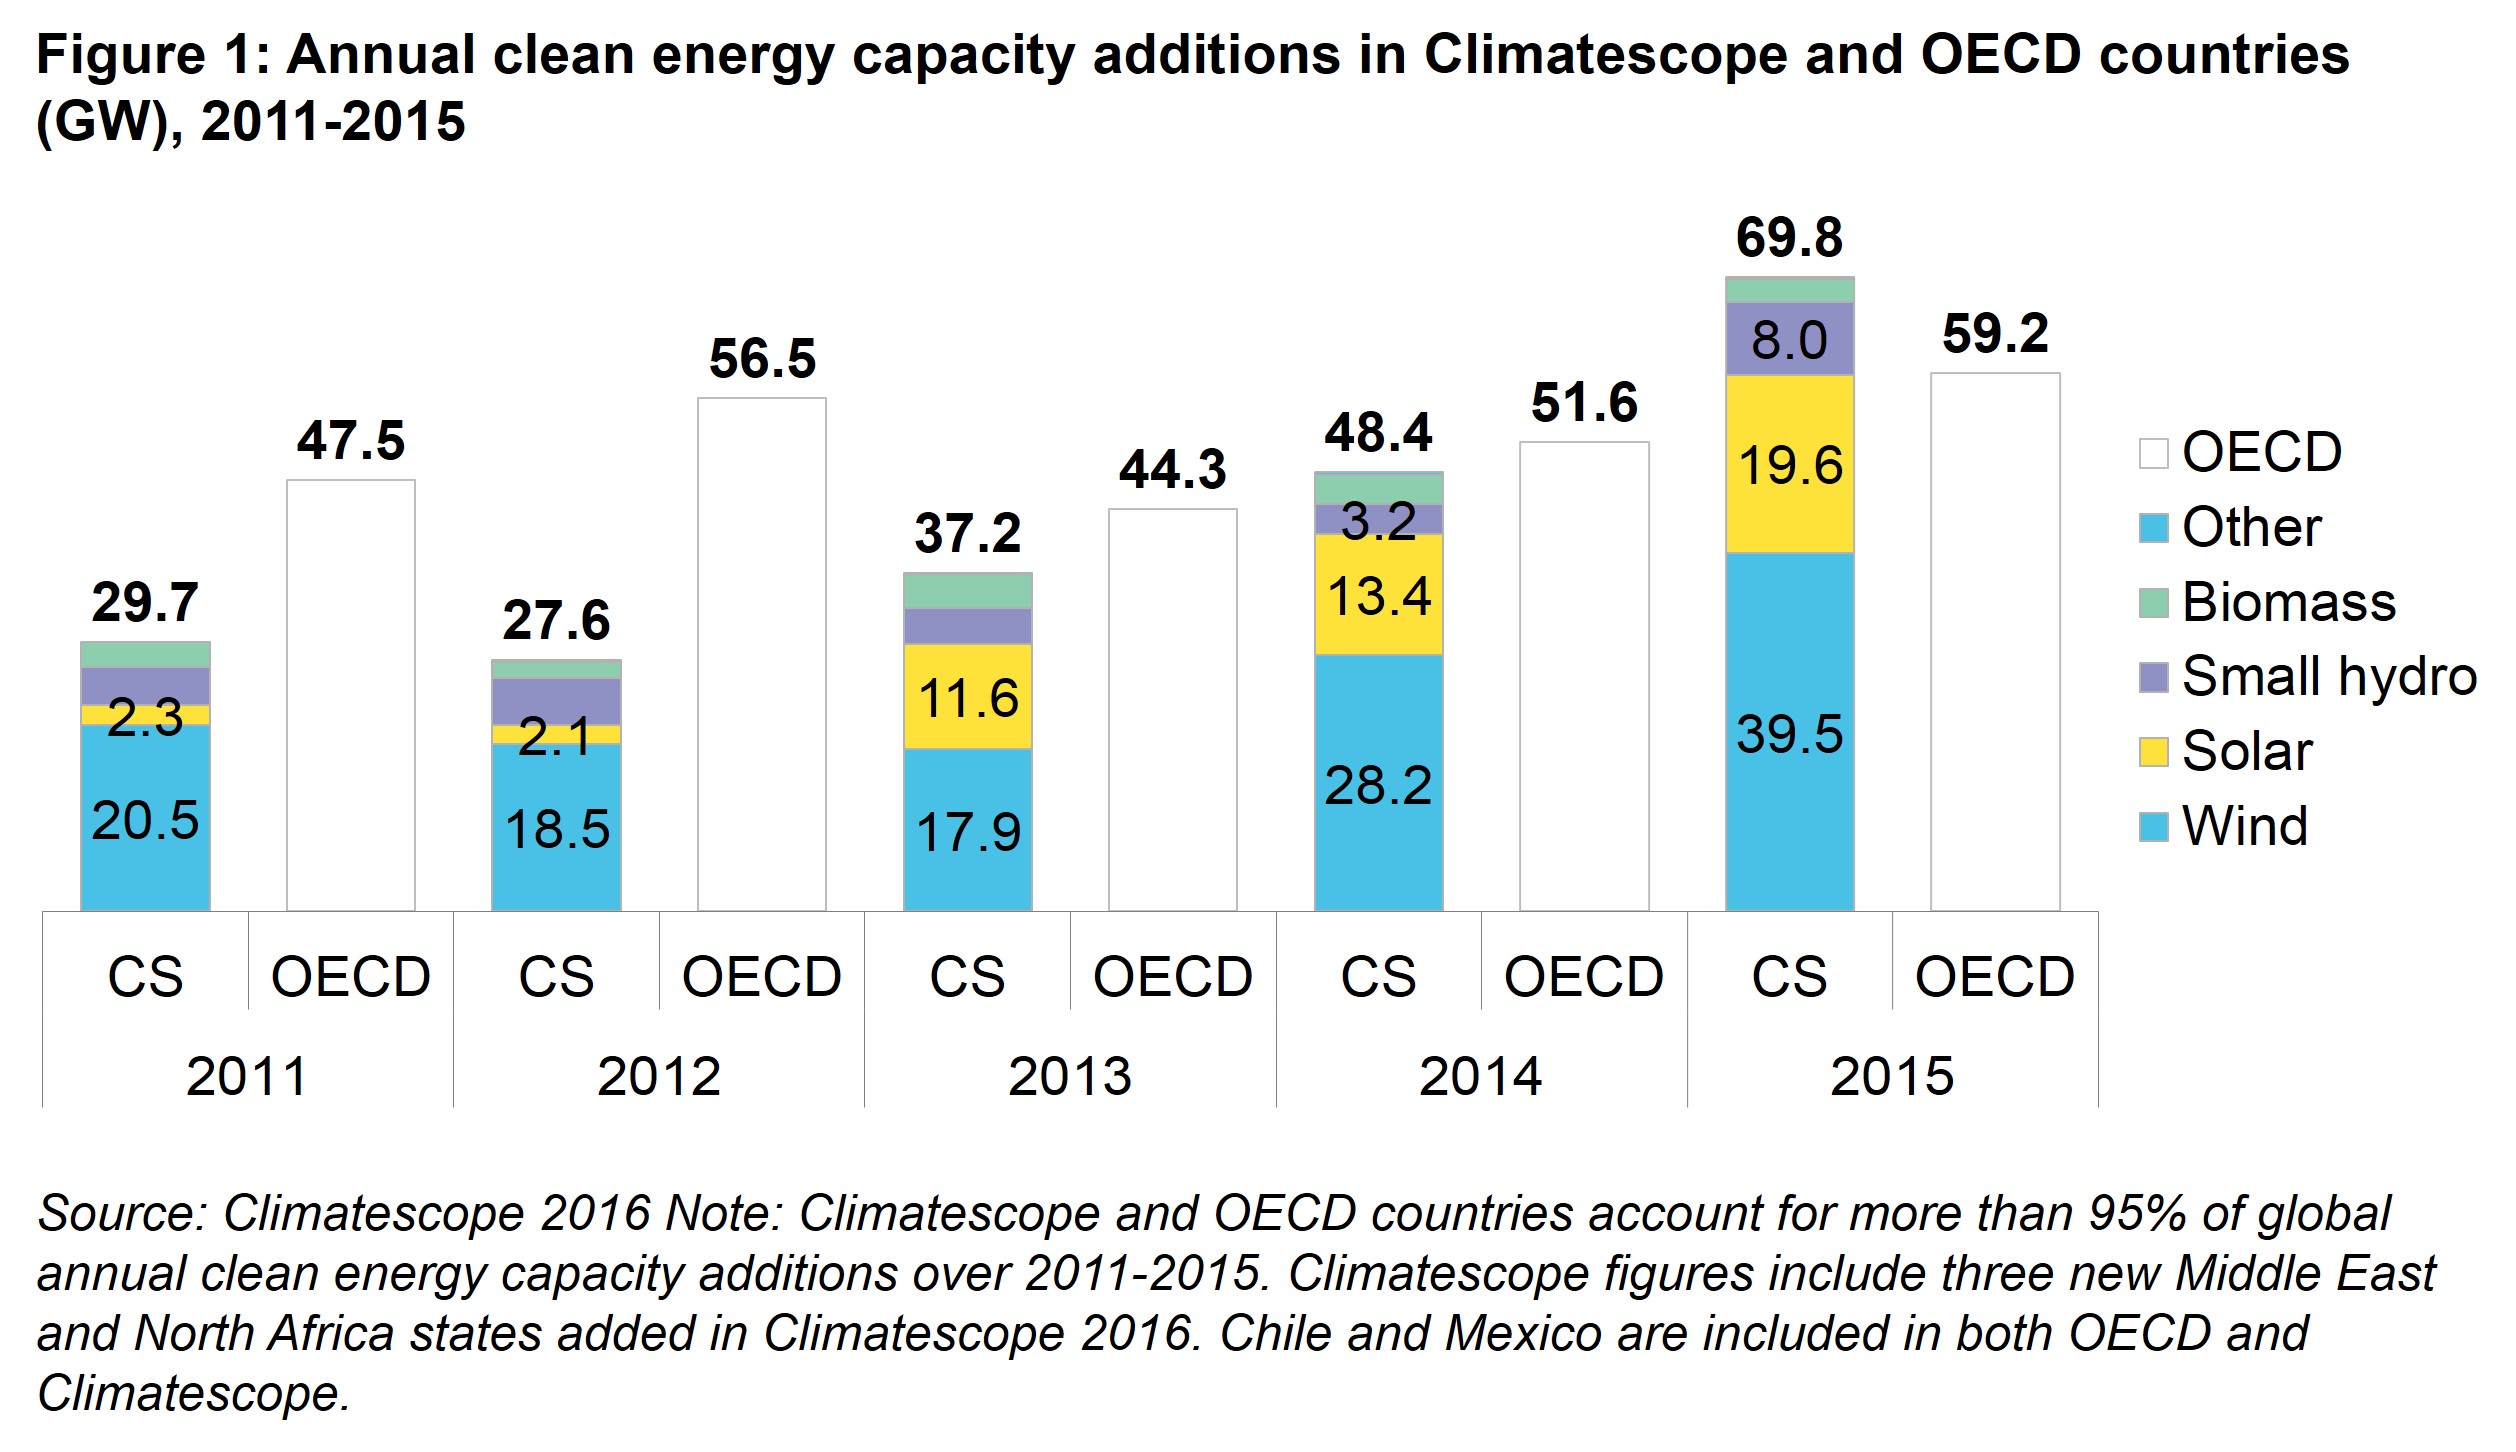
Climatescope countries in 2015 set a new record for clean energy installations with 69.8GW built, up 30% from the 48.4GW added in 2014 (Figure 1). The 2015 total represents 10.6GW more than the 59.2GW of clean energy built in OECD countries, a group which includes the world’s wealthiest nations.
Climatescope countries also for the first time nosed out OECD nations in 2015 to attract more clean energy capital (Figure 2). Investment in Climatescope countries grew 16% from 2014 to 2015 to reach $154bn. In addition, the $147bn invested into new clean energy generation in Climatescope nations in 2015 topped global investment in thermal power generation worldwide as recorded by the International Energy Agency1.
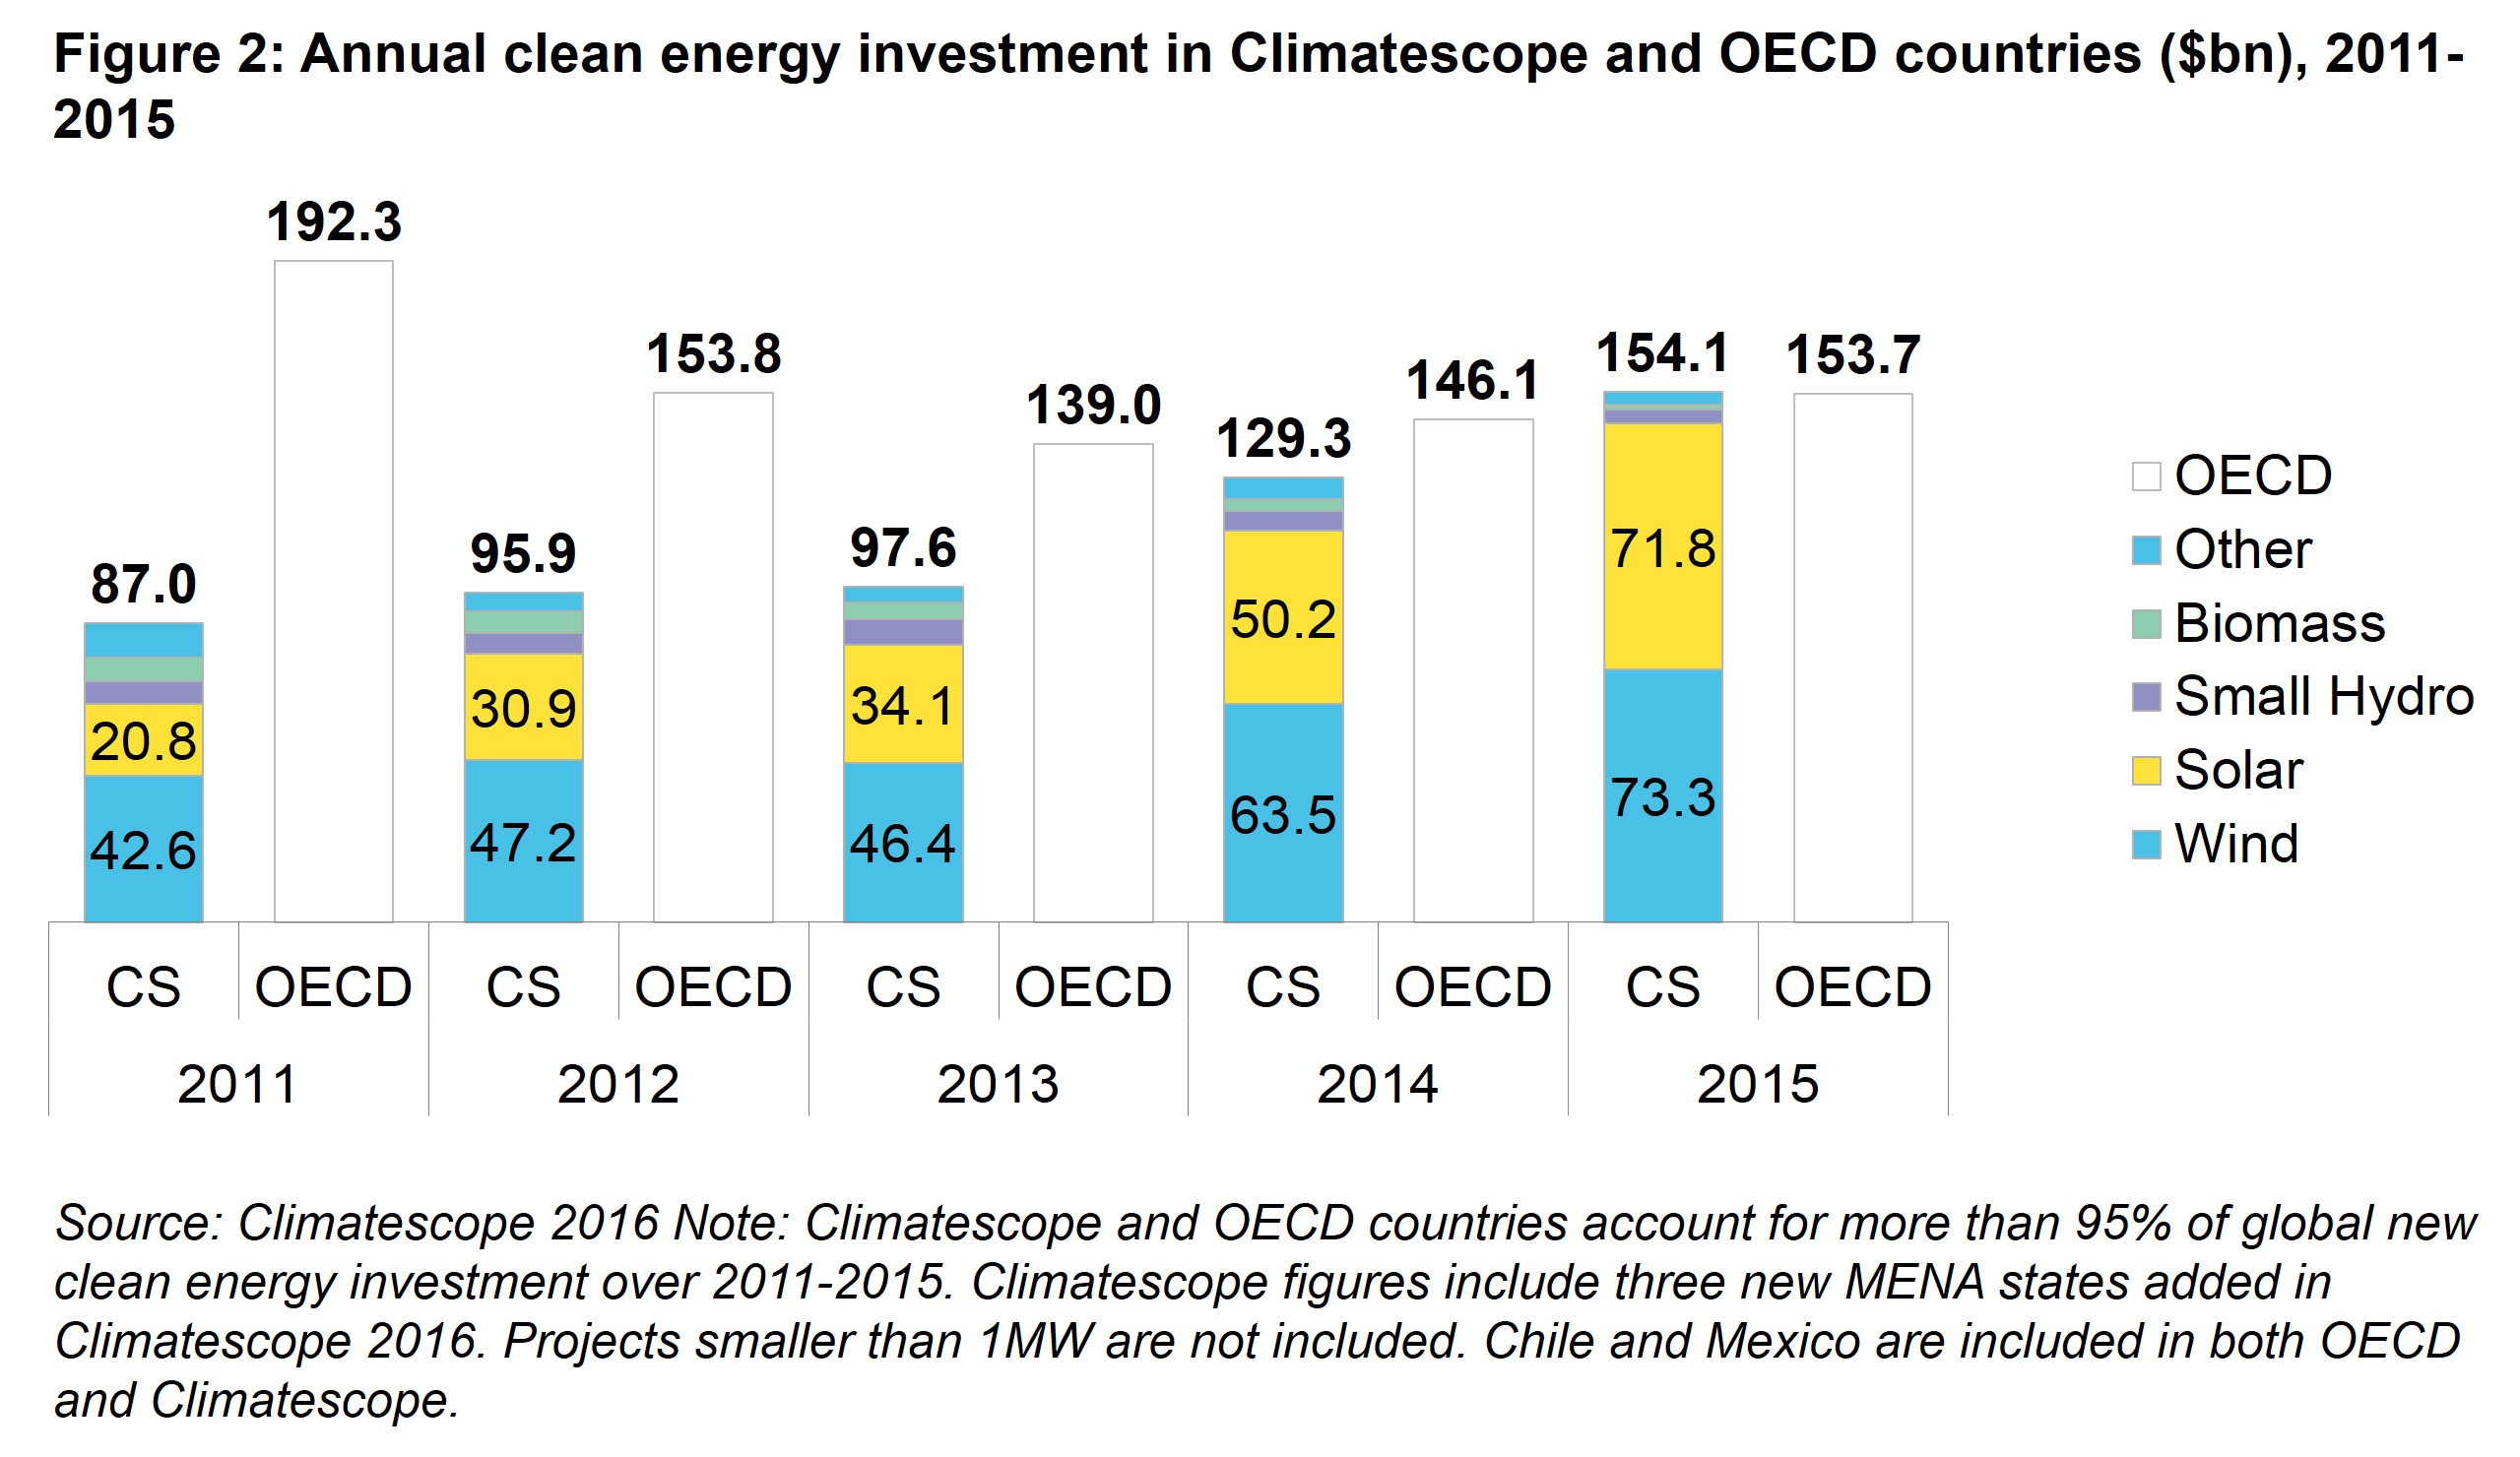
Solar and onshore wind have historically accounted for the majority of clean energy investment globally and their shares have grown substantially in recent years. Together, these technologies accounted for 65% of new clean energy investment in 2011. By 2015, that had risen to 94%.
Solar saw the largest transformation in its role, growing from 8% of investment in 2011 to just over 46% in 2015. It is also likely to top investment in wind for the first time in 2016.
It should be noted that the news was not all positive from a climate perspective. In fact, 2015 was also a record for new coal capacity added with 77GW completed in Climatescope countries. China and India contributed 52GW and 19GW of this, respectively, confirming the major role these countries will play in emissions in coming years.
STEEP SOLAR EQUIPMENT COST DECLINES ARE CATALYZING GROWTH
PV investment in Climatescope countries has grown more than 11-fold since the turn of the decade from $6.4bn in 2010 to $71.8bn in 2015. This jump is also illustrated by installed capacity, which surged from 289MW built in 2010 to 49.3GW constructed in 2015. That latter figure is equivalent to South Africa’s generation capacity today.
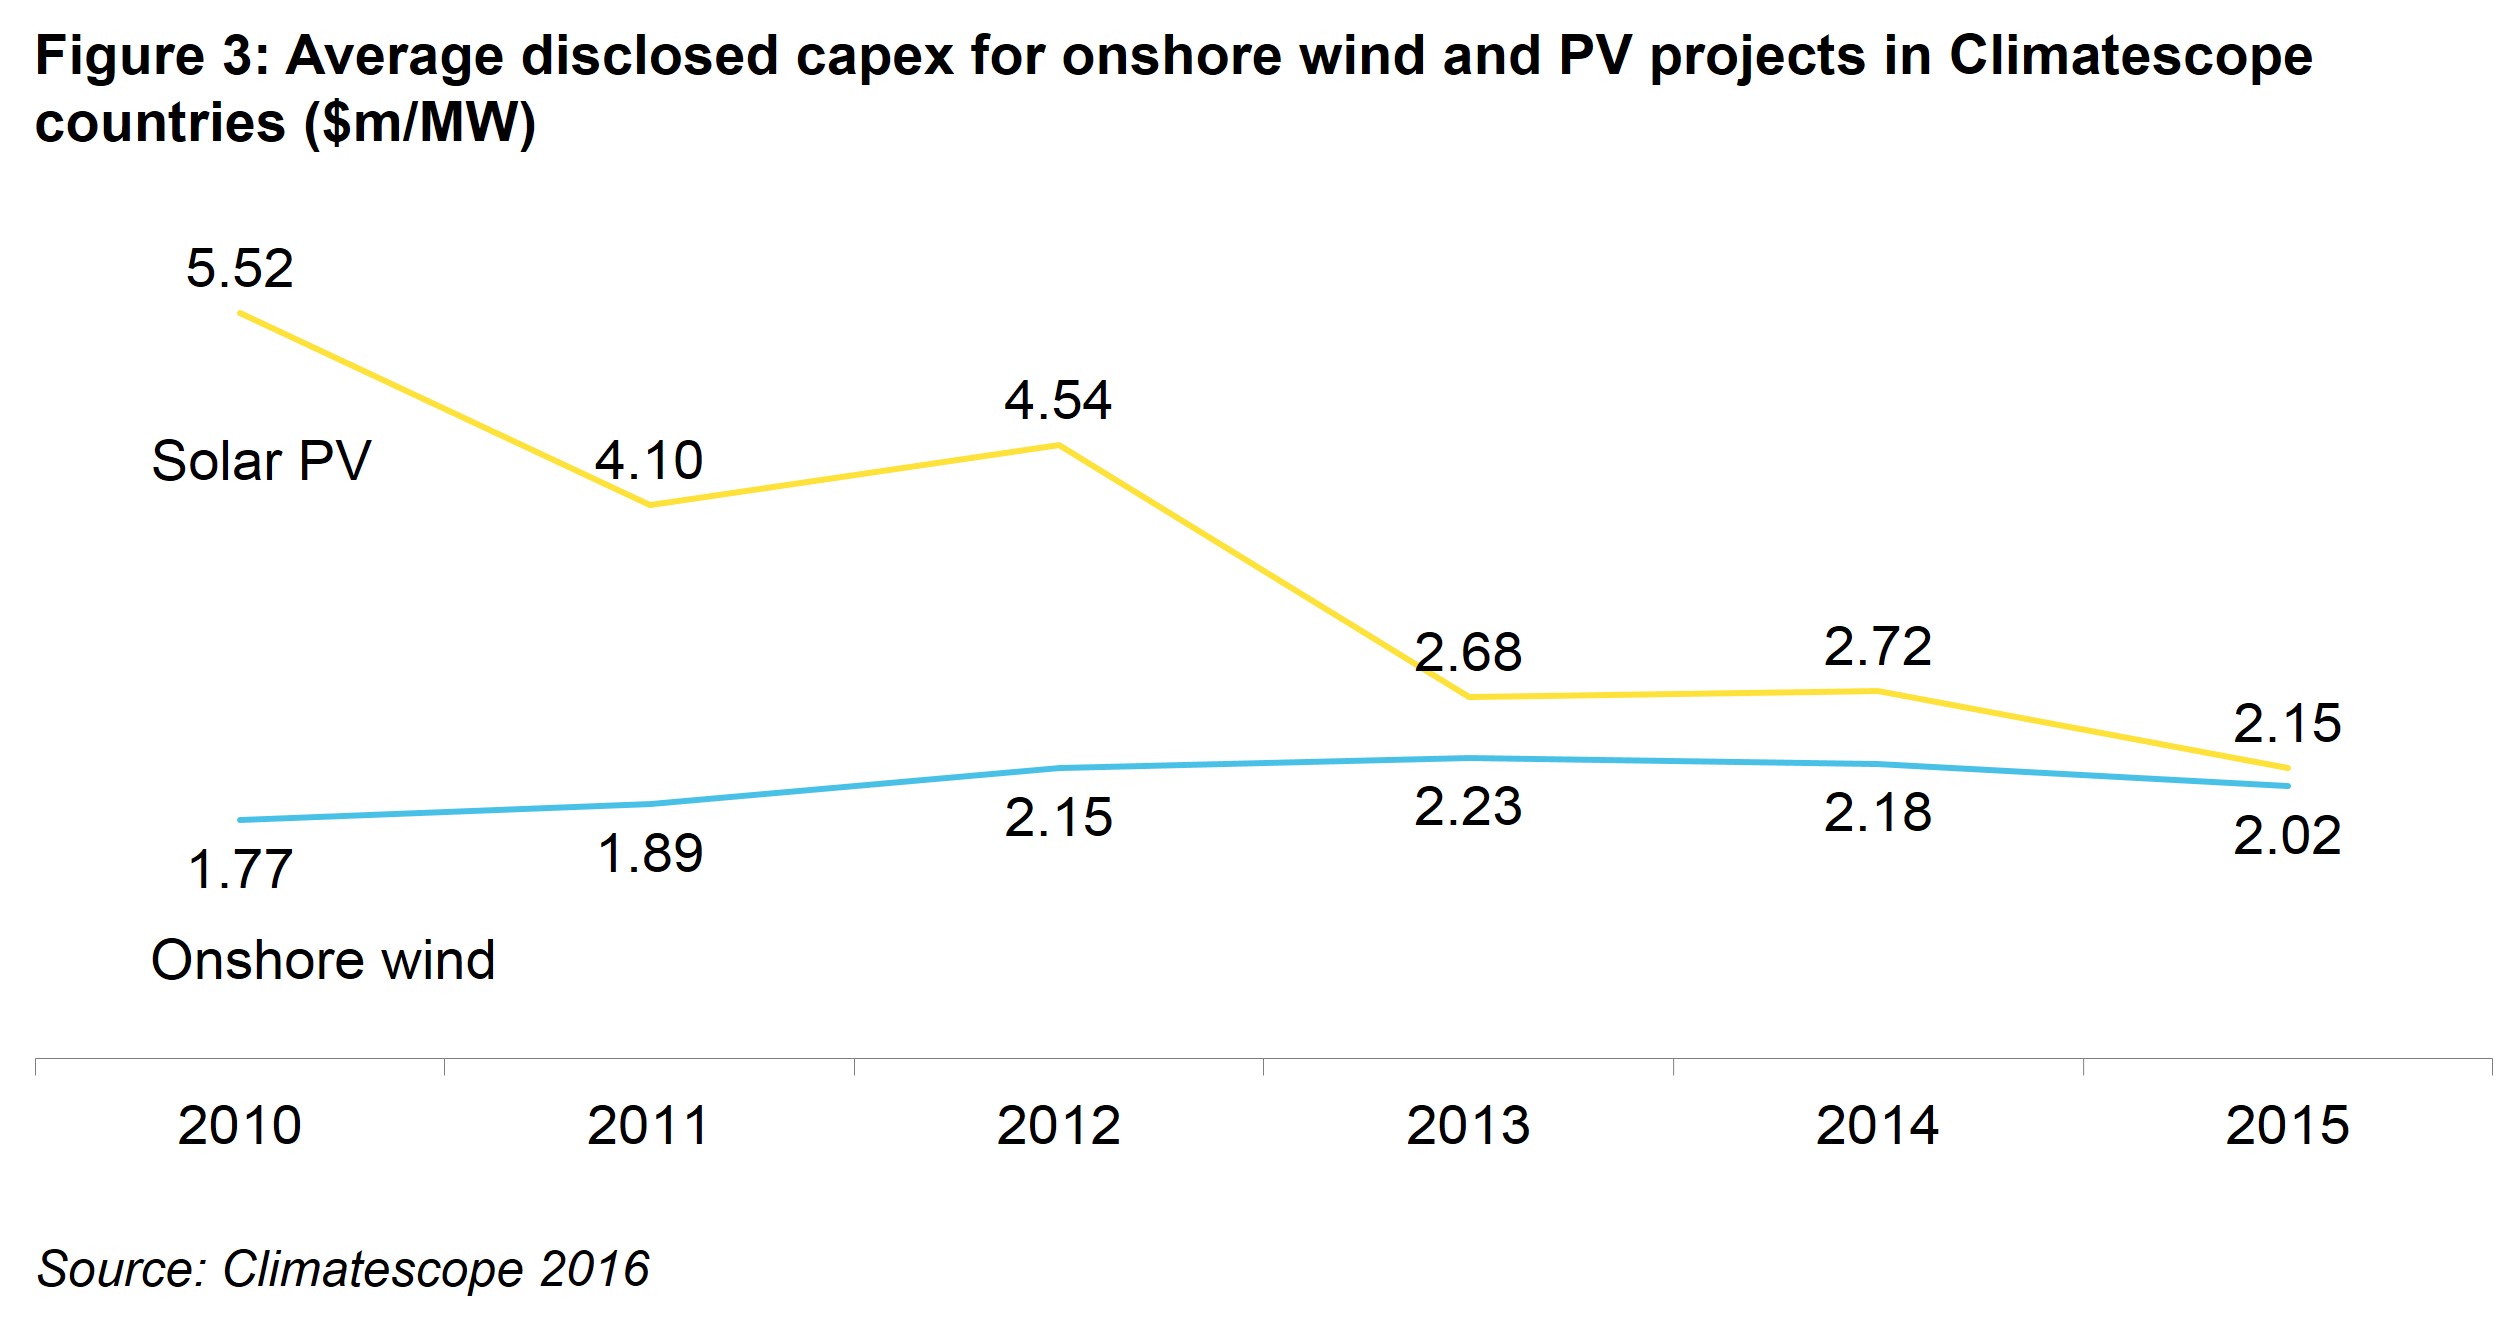
Among all clean energy technologies, PV has seen its costs fall fastest and furthest over the last decade. This has allowed capital expenditures (capex) for projects in Climatescope countries to drop by more than half since 2010 (Figure 3). It has also allowed PV project developers to sell their power at lower, more competitive rates.
Lower costs have opened new markets. As of year-end 2015, 38 of 58 Climatescope countries had recorded at least one investment in a utility-scale solar PV project. By comparison, just seven had seen such activity as of year-end 2010. Clean energy auctions in countries like Chile, Mexico, and South Africa have resulted in growing volumes of electricity purchased at well below $100/MWh with the lowest coming in Chile at $29.1/MWh.
EQUIPMENT COST DECLINES, MOST NOTABLY FOR SOLAR, ALONG WITH INNOVATIVE BUSINESS AND FINANCING MODELS ARE REVOLUTIONIZING HOW ENERGY ACCESS ISSUES ARE BEING ADDRESSED
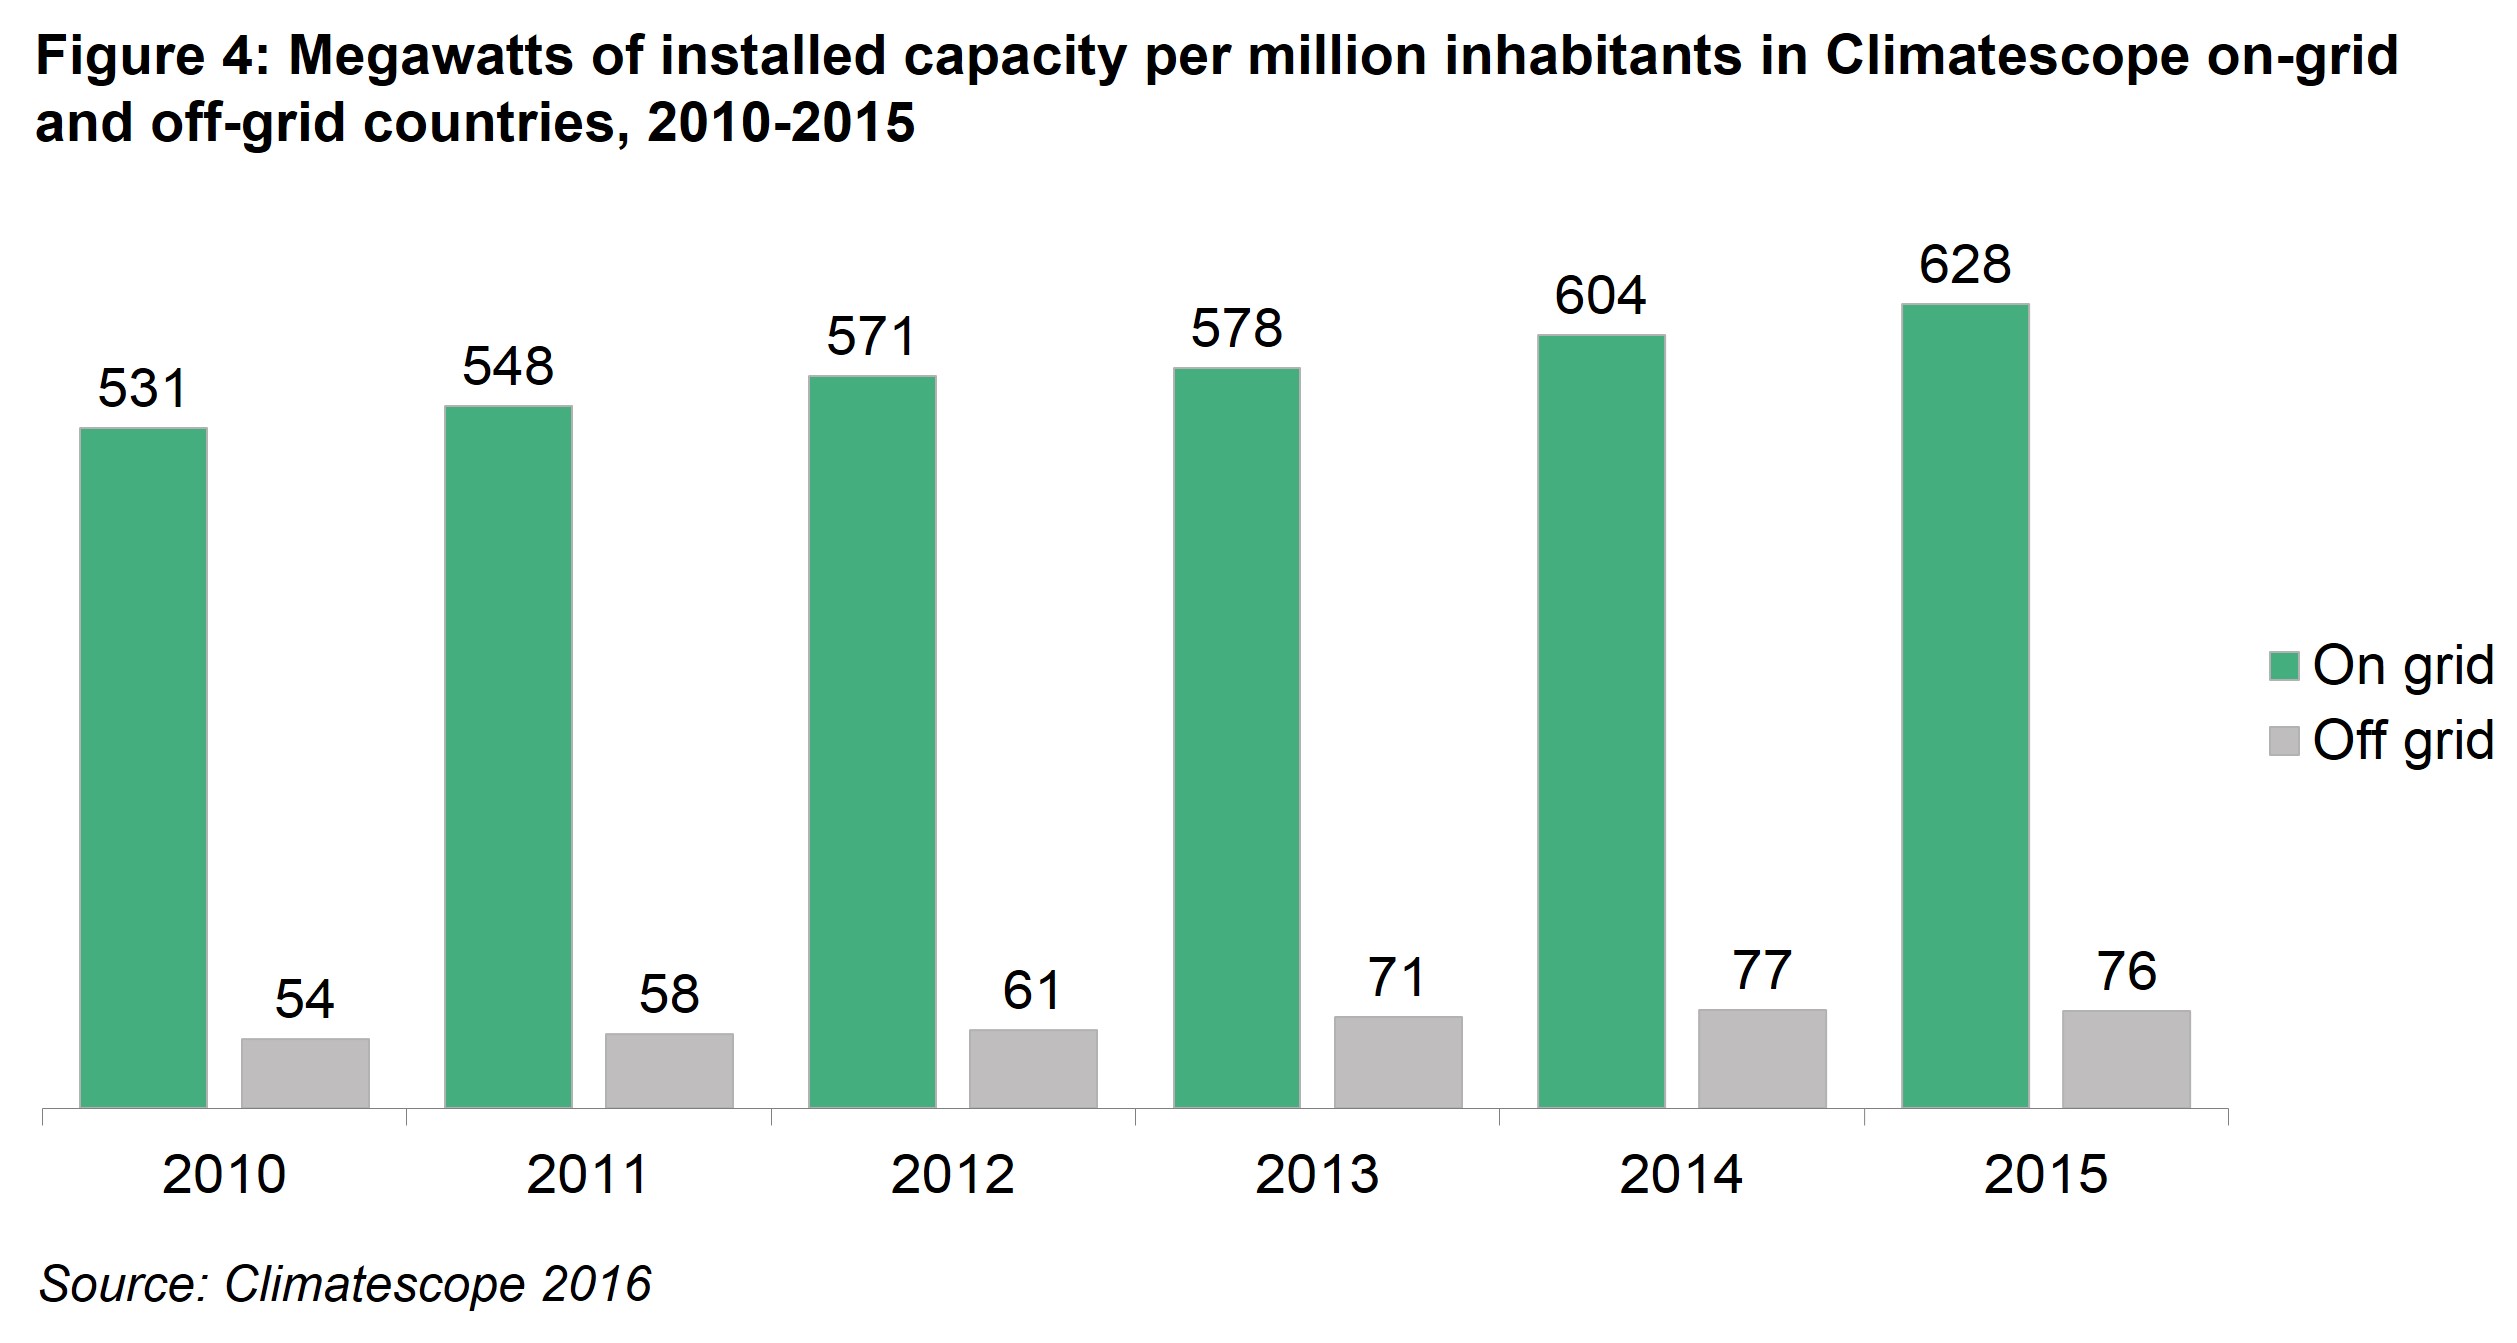
Climatescope includes 23 nations classified as “off-grid”, primarily due to their low electrification rates. The 35 others in the survey are considered “on grid” and tend to fall more into what the World Bank would consider a “middle income” category.
The gap between these groups of countries is wide when power generation capacity vs. population is compared (Figure 4). However, the dramatic drop in PV equipment and associated technology costs have sparked a slew of start-ups aiming to address the energy access conundrum from the bottom up. In some cases, these firms distribute pico-scale solar systems, in others they build mini-grids to power small communities. These efforts are, in turn, prompting a reconsideration of how to confront the massive energy access challenge and empower the 1.4bn people whose basic energy needs today remain unmet.
As of June 2015, just under 11m households were estimated to be equipped with pico-PV systems. Typically, these consisted of basic devices to power just a few lights and charge mobile phones. Distribution of such systems has flourished in countries with “mobile money” availability, allowing consumers to pay for their systems or for the power produced over their mobile phones.
Climatescope countries, particularly those in Eastern Africa, are home to some of the world’s most successful “pay-as-you-go” solar companies and these have attracted a growing interest from venture capital investors. Off-grid solar companies located in the African markets reviewed in Climatescope have attracted approximately $115m of venture capital investments since 2012, $90m of which was invested in East African countries. Globally, Bloomberg New Energy Finance has tracked $450m of investment into the off-grid renewables sector excluding minigrids through 2015 (Figure 5).
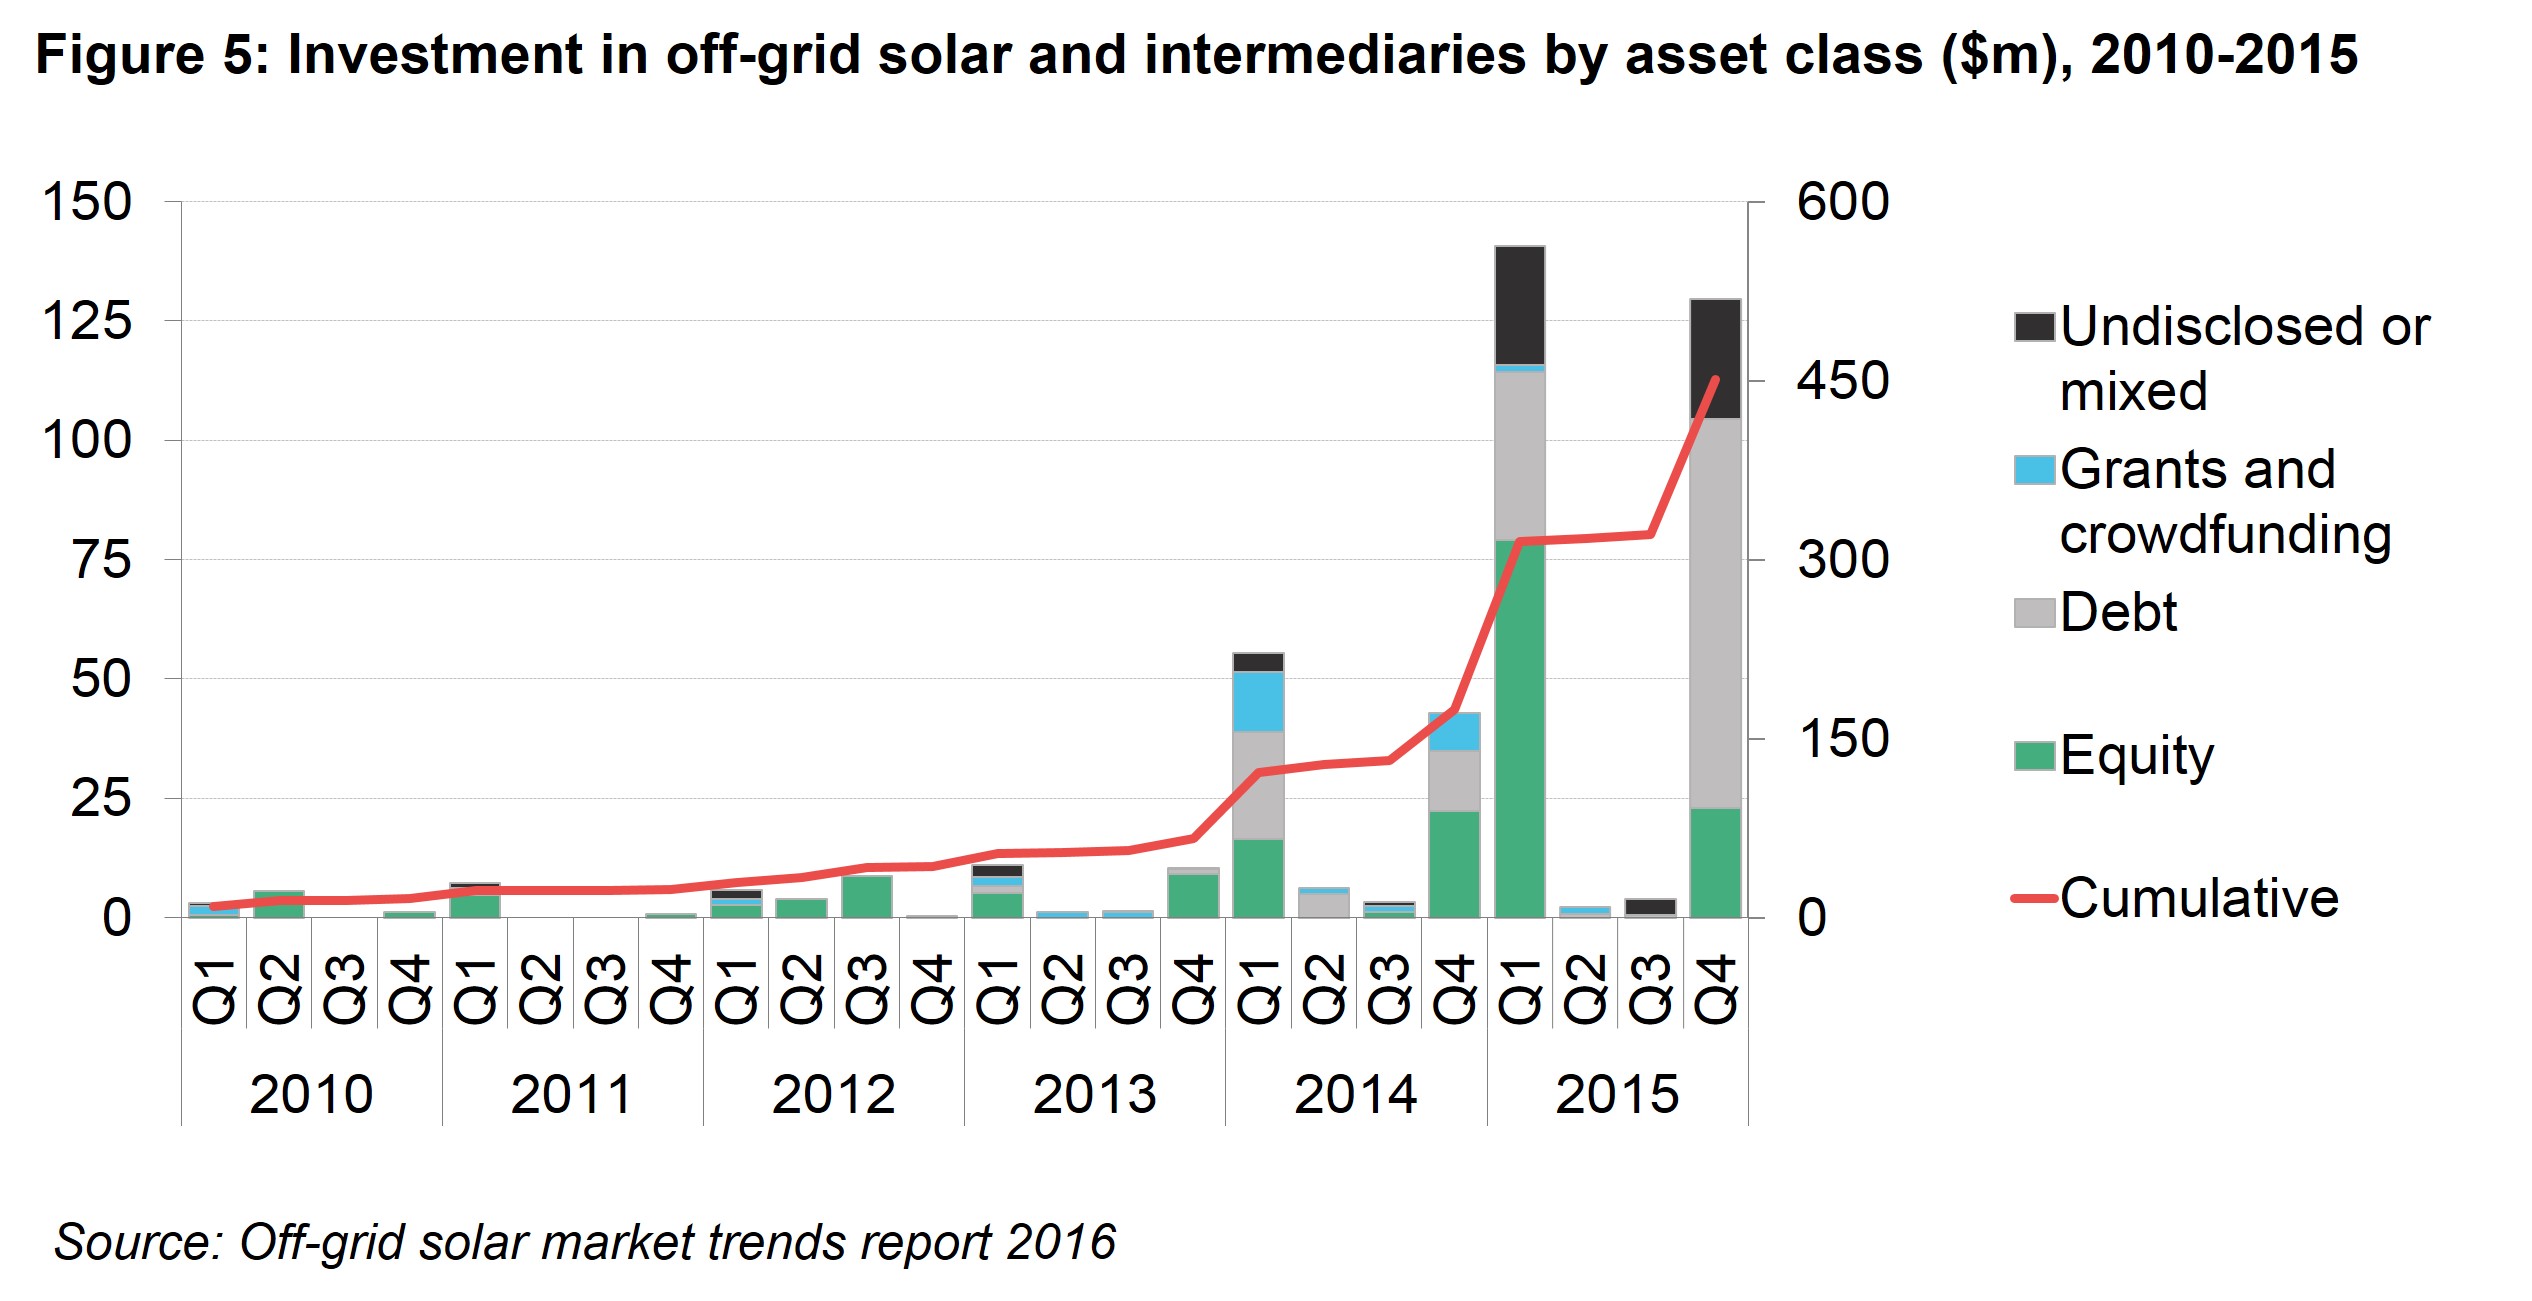
Capital raised by these firms has accelerated dramatically since the start of 2014, including three quarters in which investment topped $50m. In each of these quarters, it was a single off-grid start-up which accounted for the large majority of funds raised.
Up until 2013, grant and equity capital were mainly available to these firms as most were regarded as too risky to secure loans. Since establishing track records, however, some have been able to tap financial institutions for debt to fund expansion.
Coming years will determine exactly what contribution these newer off-grid solutions can make toward improving electrification rates. In many cases, the use of renewables in mini-grids or standalone system will offer cost-effective ways to provide consumers access to the fundamental energy services they need the most.
There is hardly a one-size-fits-all answer to the energy access conundrum, however. Distributed renewable energy solutions, including mini-grids, will no doubt prove more effective in some countries than others. As national governments and supporting donor agencies seek to address these issues now, however, they have more options to choose from than just a few years ago. And this is due both to a decline in equipment prices and the ingenuity of start-up players looking to put that equipment to work.
SPURRED BY THE PARIS ACCORD, FOUR OUT OF FIVE CLIMATESCOPE NATIONS NOW HAVE NATIONAL CLEAN ENERGY TARGETS WHILE THREE IN FOUR HAVE SET CO2 EMISSIONS GOALS
Developing countries, China and India especially, greatly contributed to the successful ratification of the Paris Agreement at the 21st meeting of the parties to the United Nations Framework Convention on Climate Change (UNFCCC) in December 2015. Every one of the 58 Climatescope countries with the exception of Nicaragua was a Paris signatory as of Q3 2016.
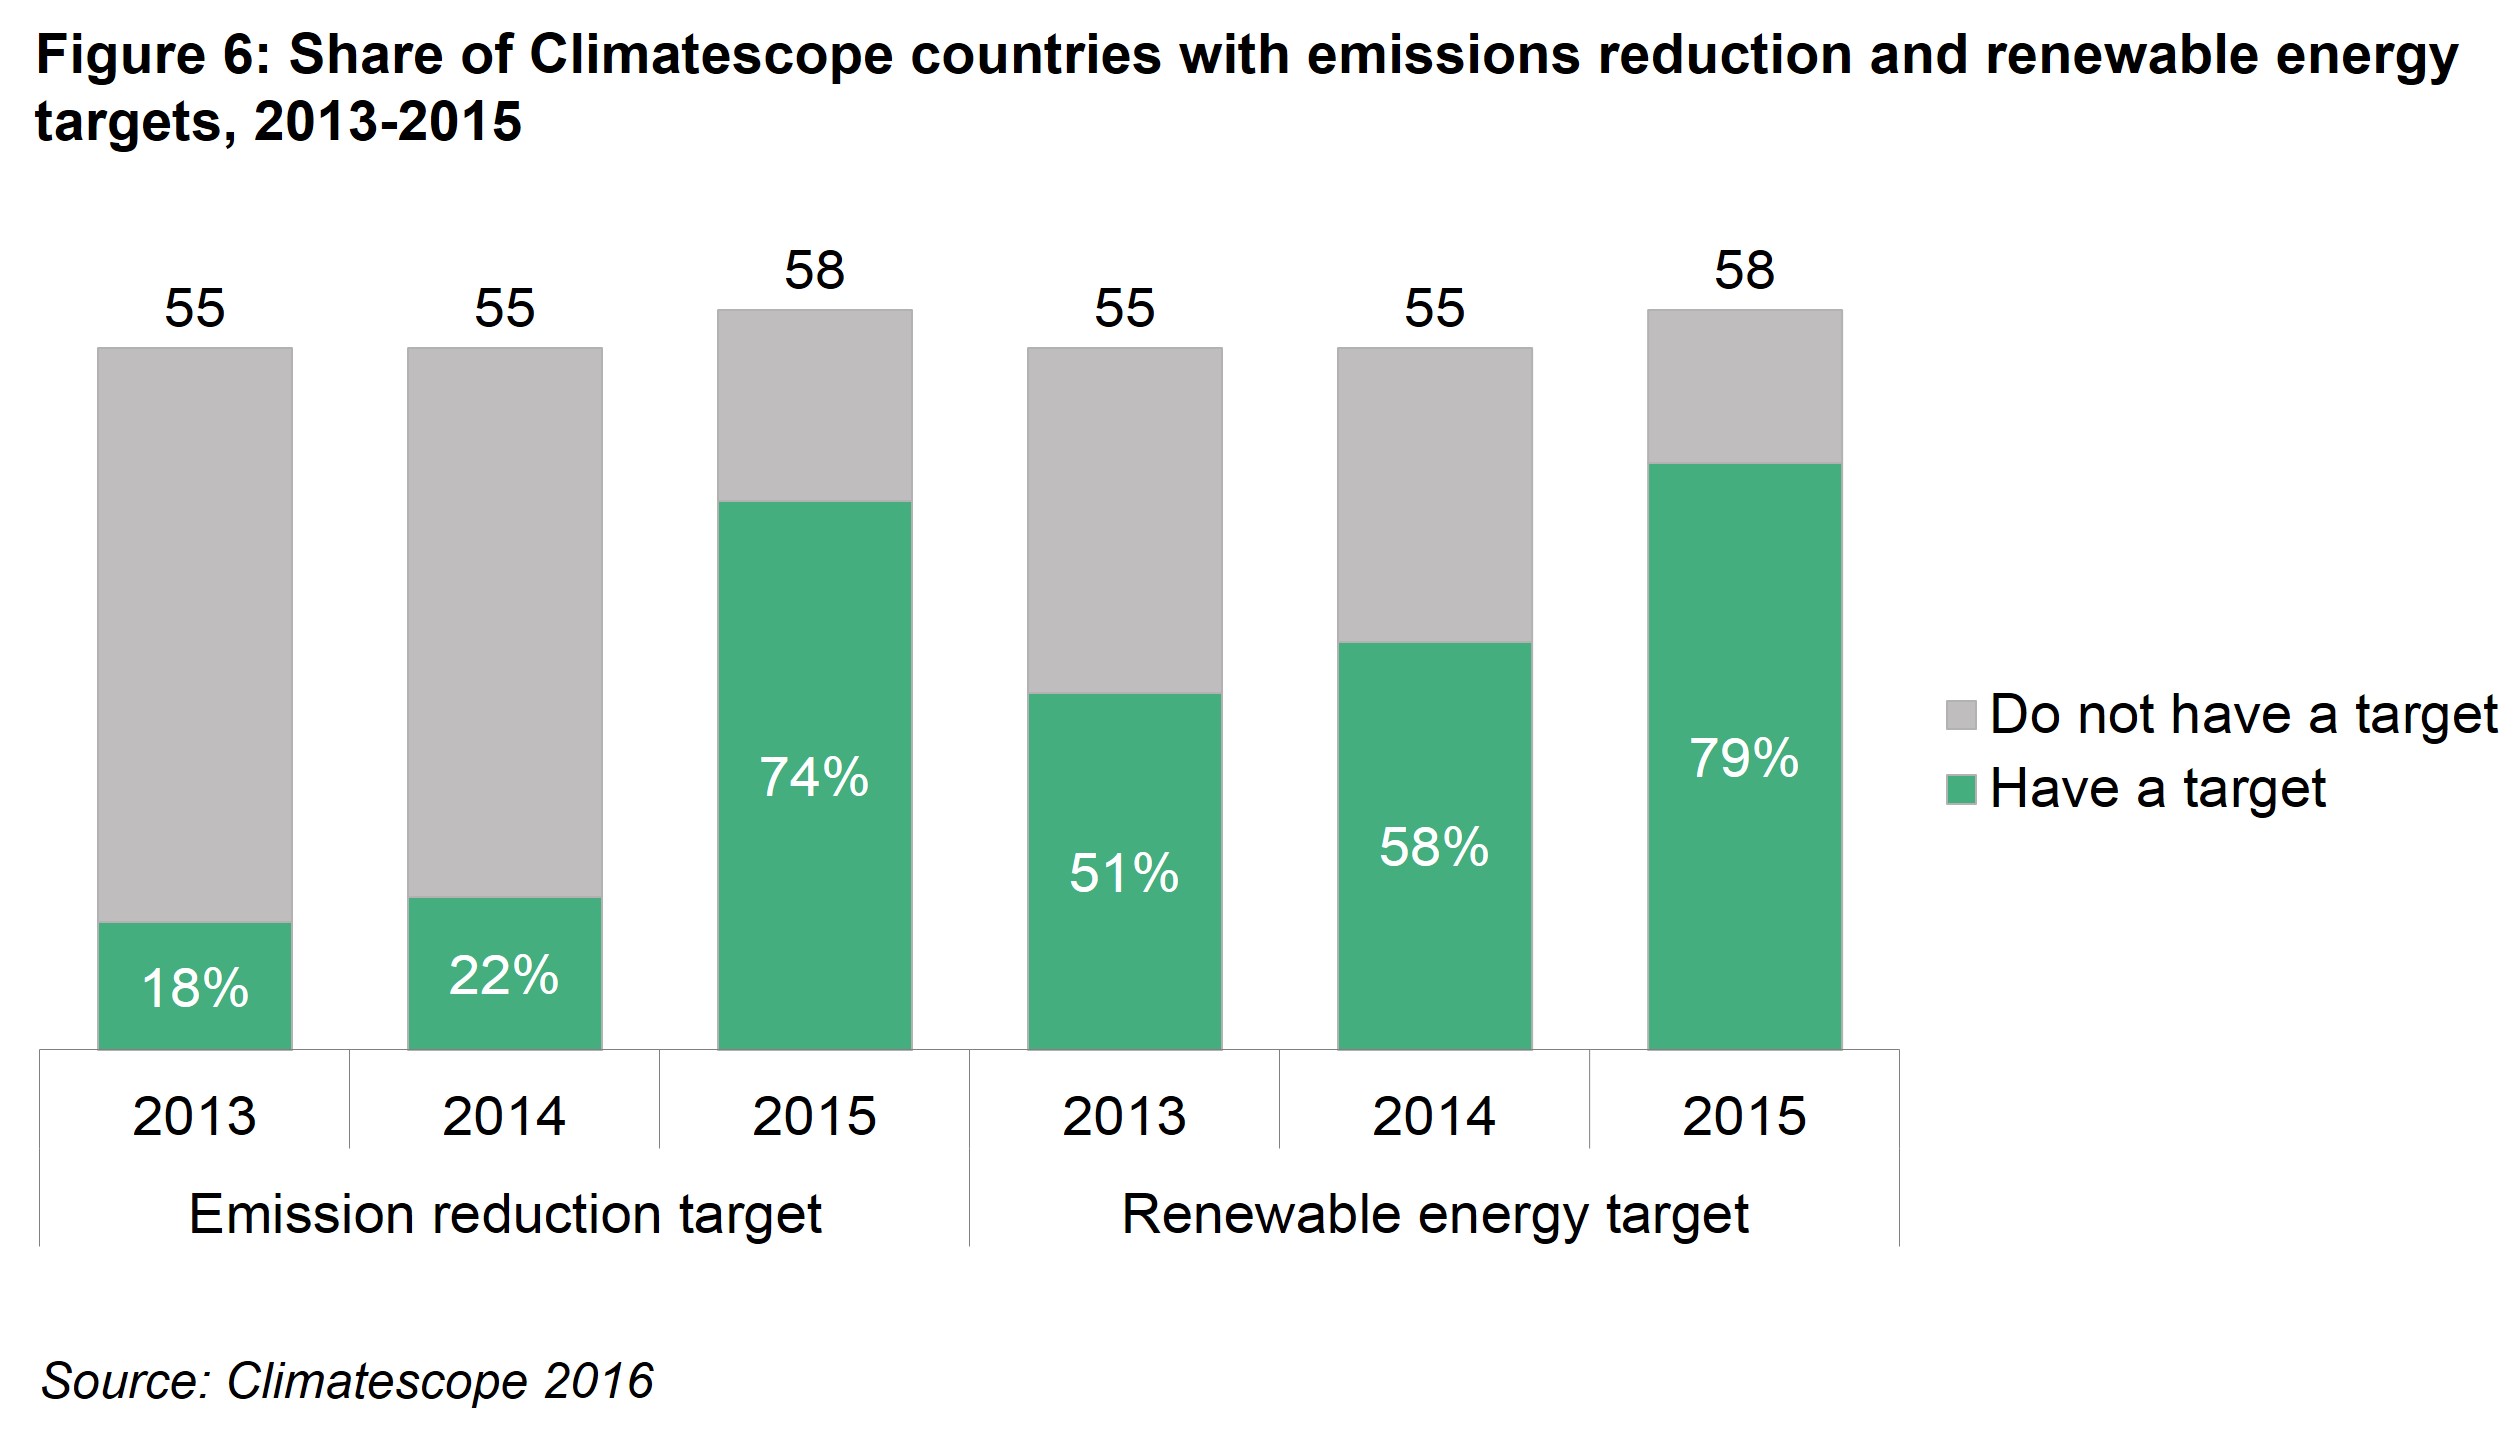
More than three quarters of Climatescope countries had set emissions reductions and clean energy targets by year-end 2015, up markedly from 2013 when 18% had such goals and just half had set clean energy deployment objectives (Figure 6). This is a key development in global efforts to mitigate climate change given that Climatescope countries accounted half the world’s greenhouse gas emissions in 2012. With the economies of emerging market countries growing at a much faster pace than more developed nations, they are expected to account for the lion’s share of future CO2 emissions growth.
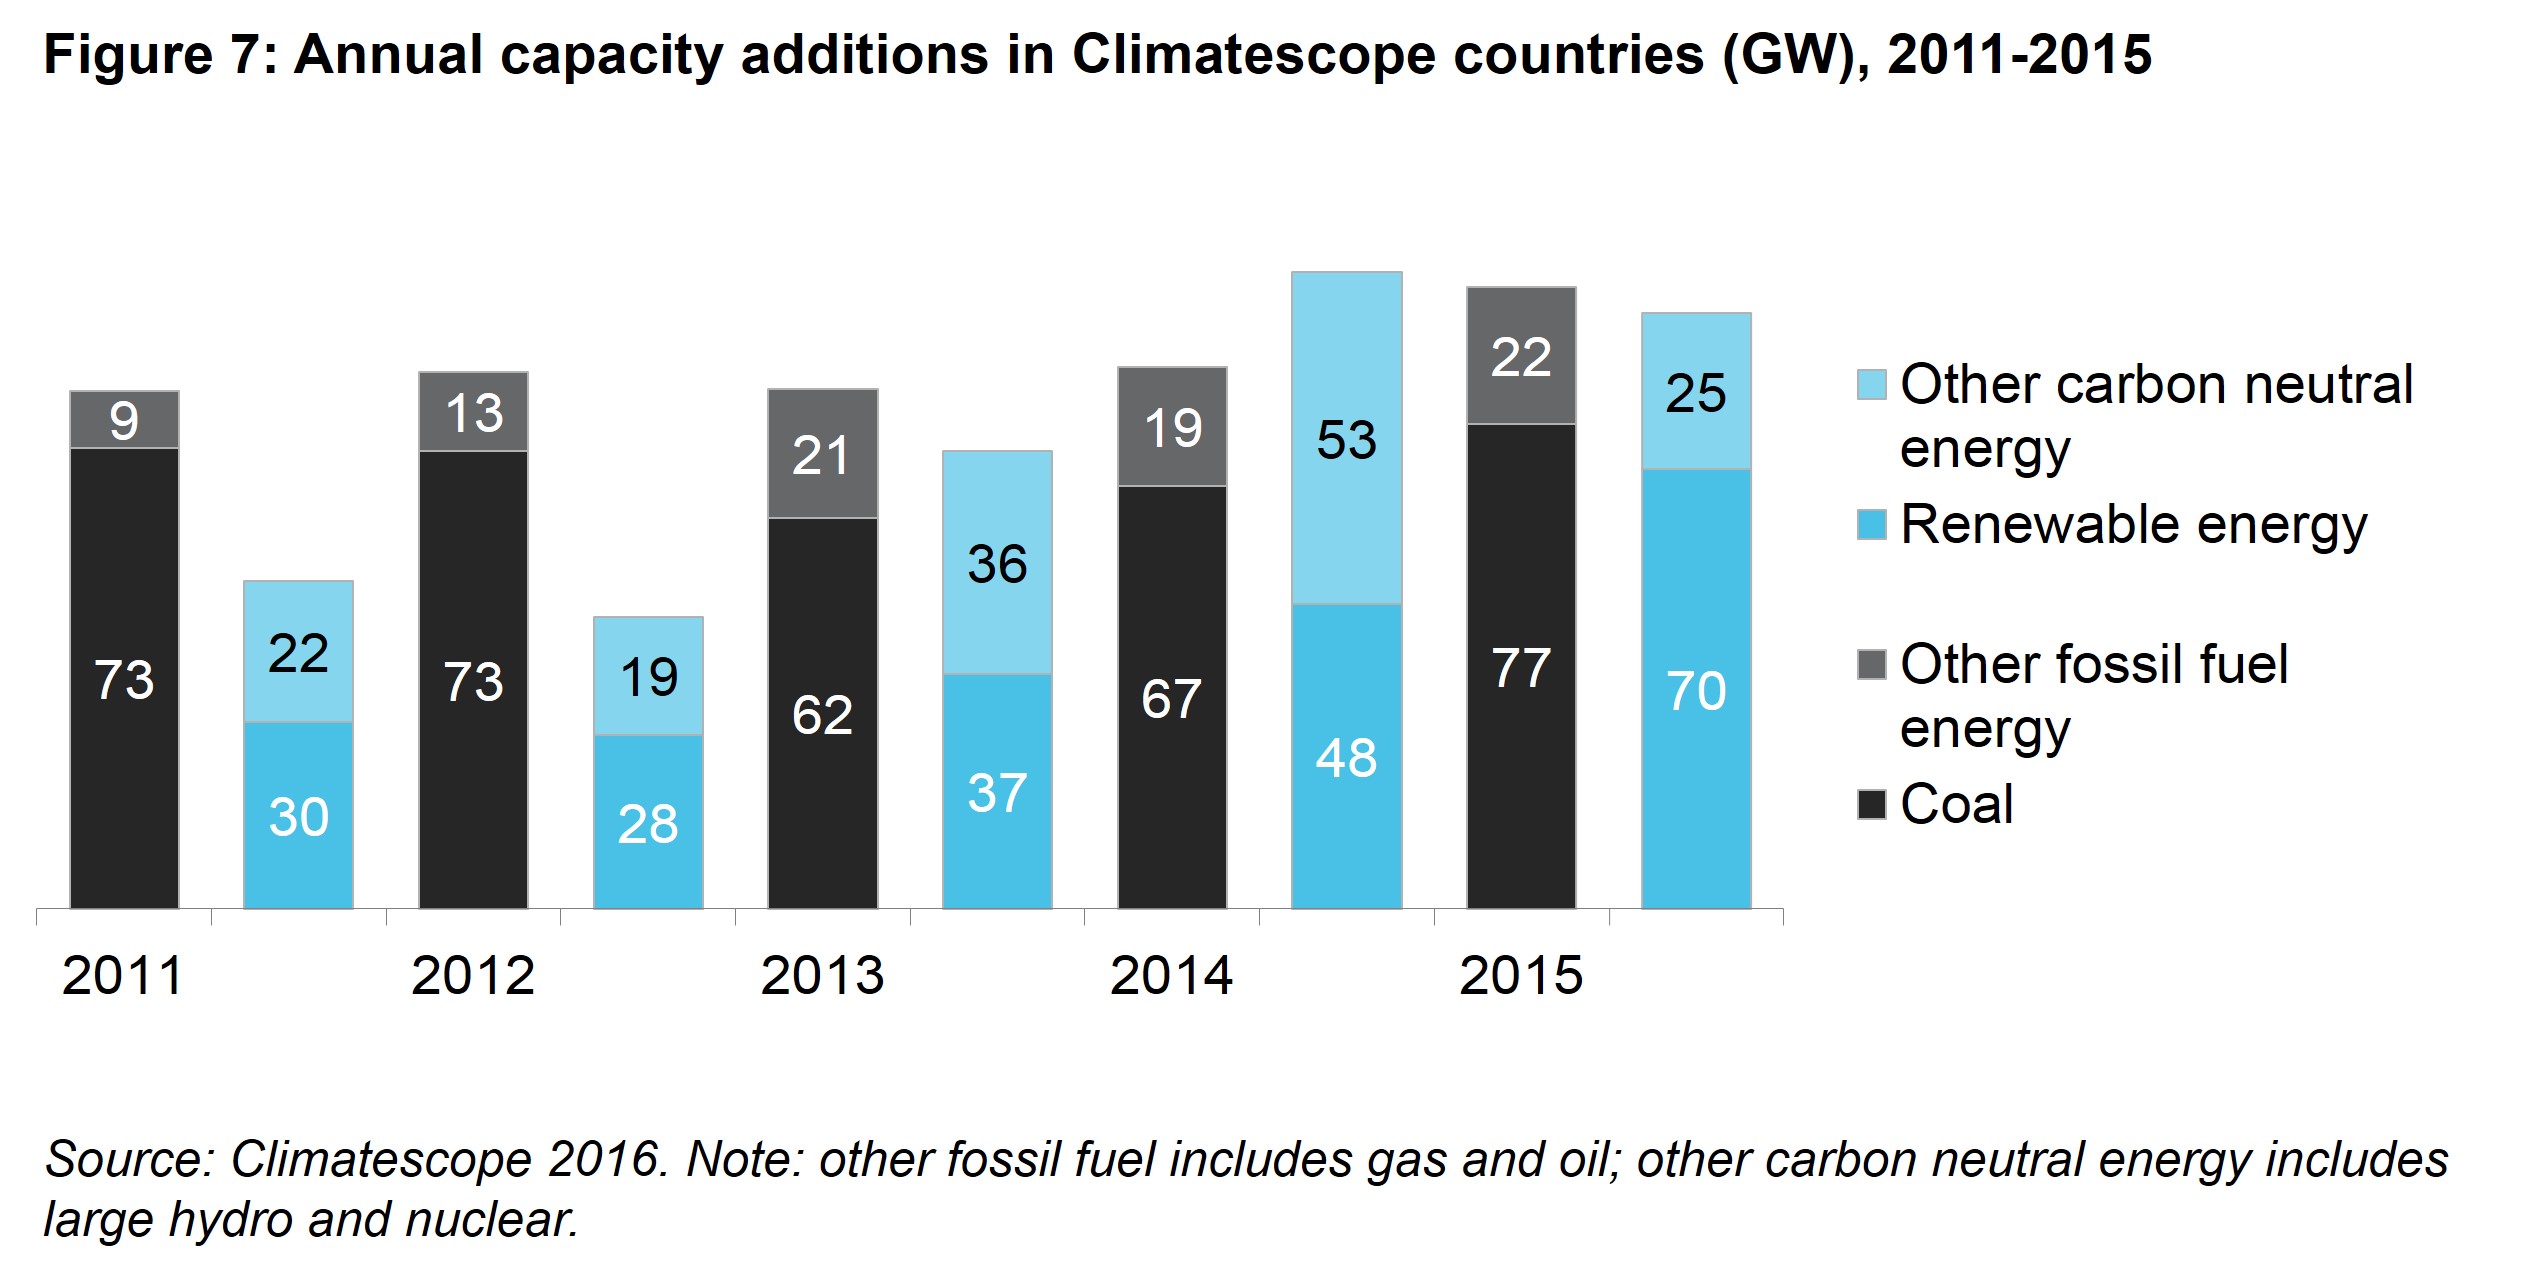
The ambition and implementation of these targets will be all the more important considering the pace at which new fossil generation capacity is being added across Climatescope countries (Figure 7). In fact, as mentioned above, 2015 was a record for new coal with 77GW added in Climatescope countries.
WEALTHIER NATIONS ARE ACCELERATING FUNDING FOR CLEAN ENERGY IN EMERGING MARKETS
The majority of capital for clean energy projects in Climatescope nations originates from within the countries themselves. However, financial institutions based in OECD countries do appear to be taking a larger role in financing renewables in emerging markets (Figure 8).
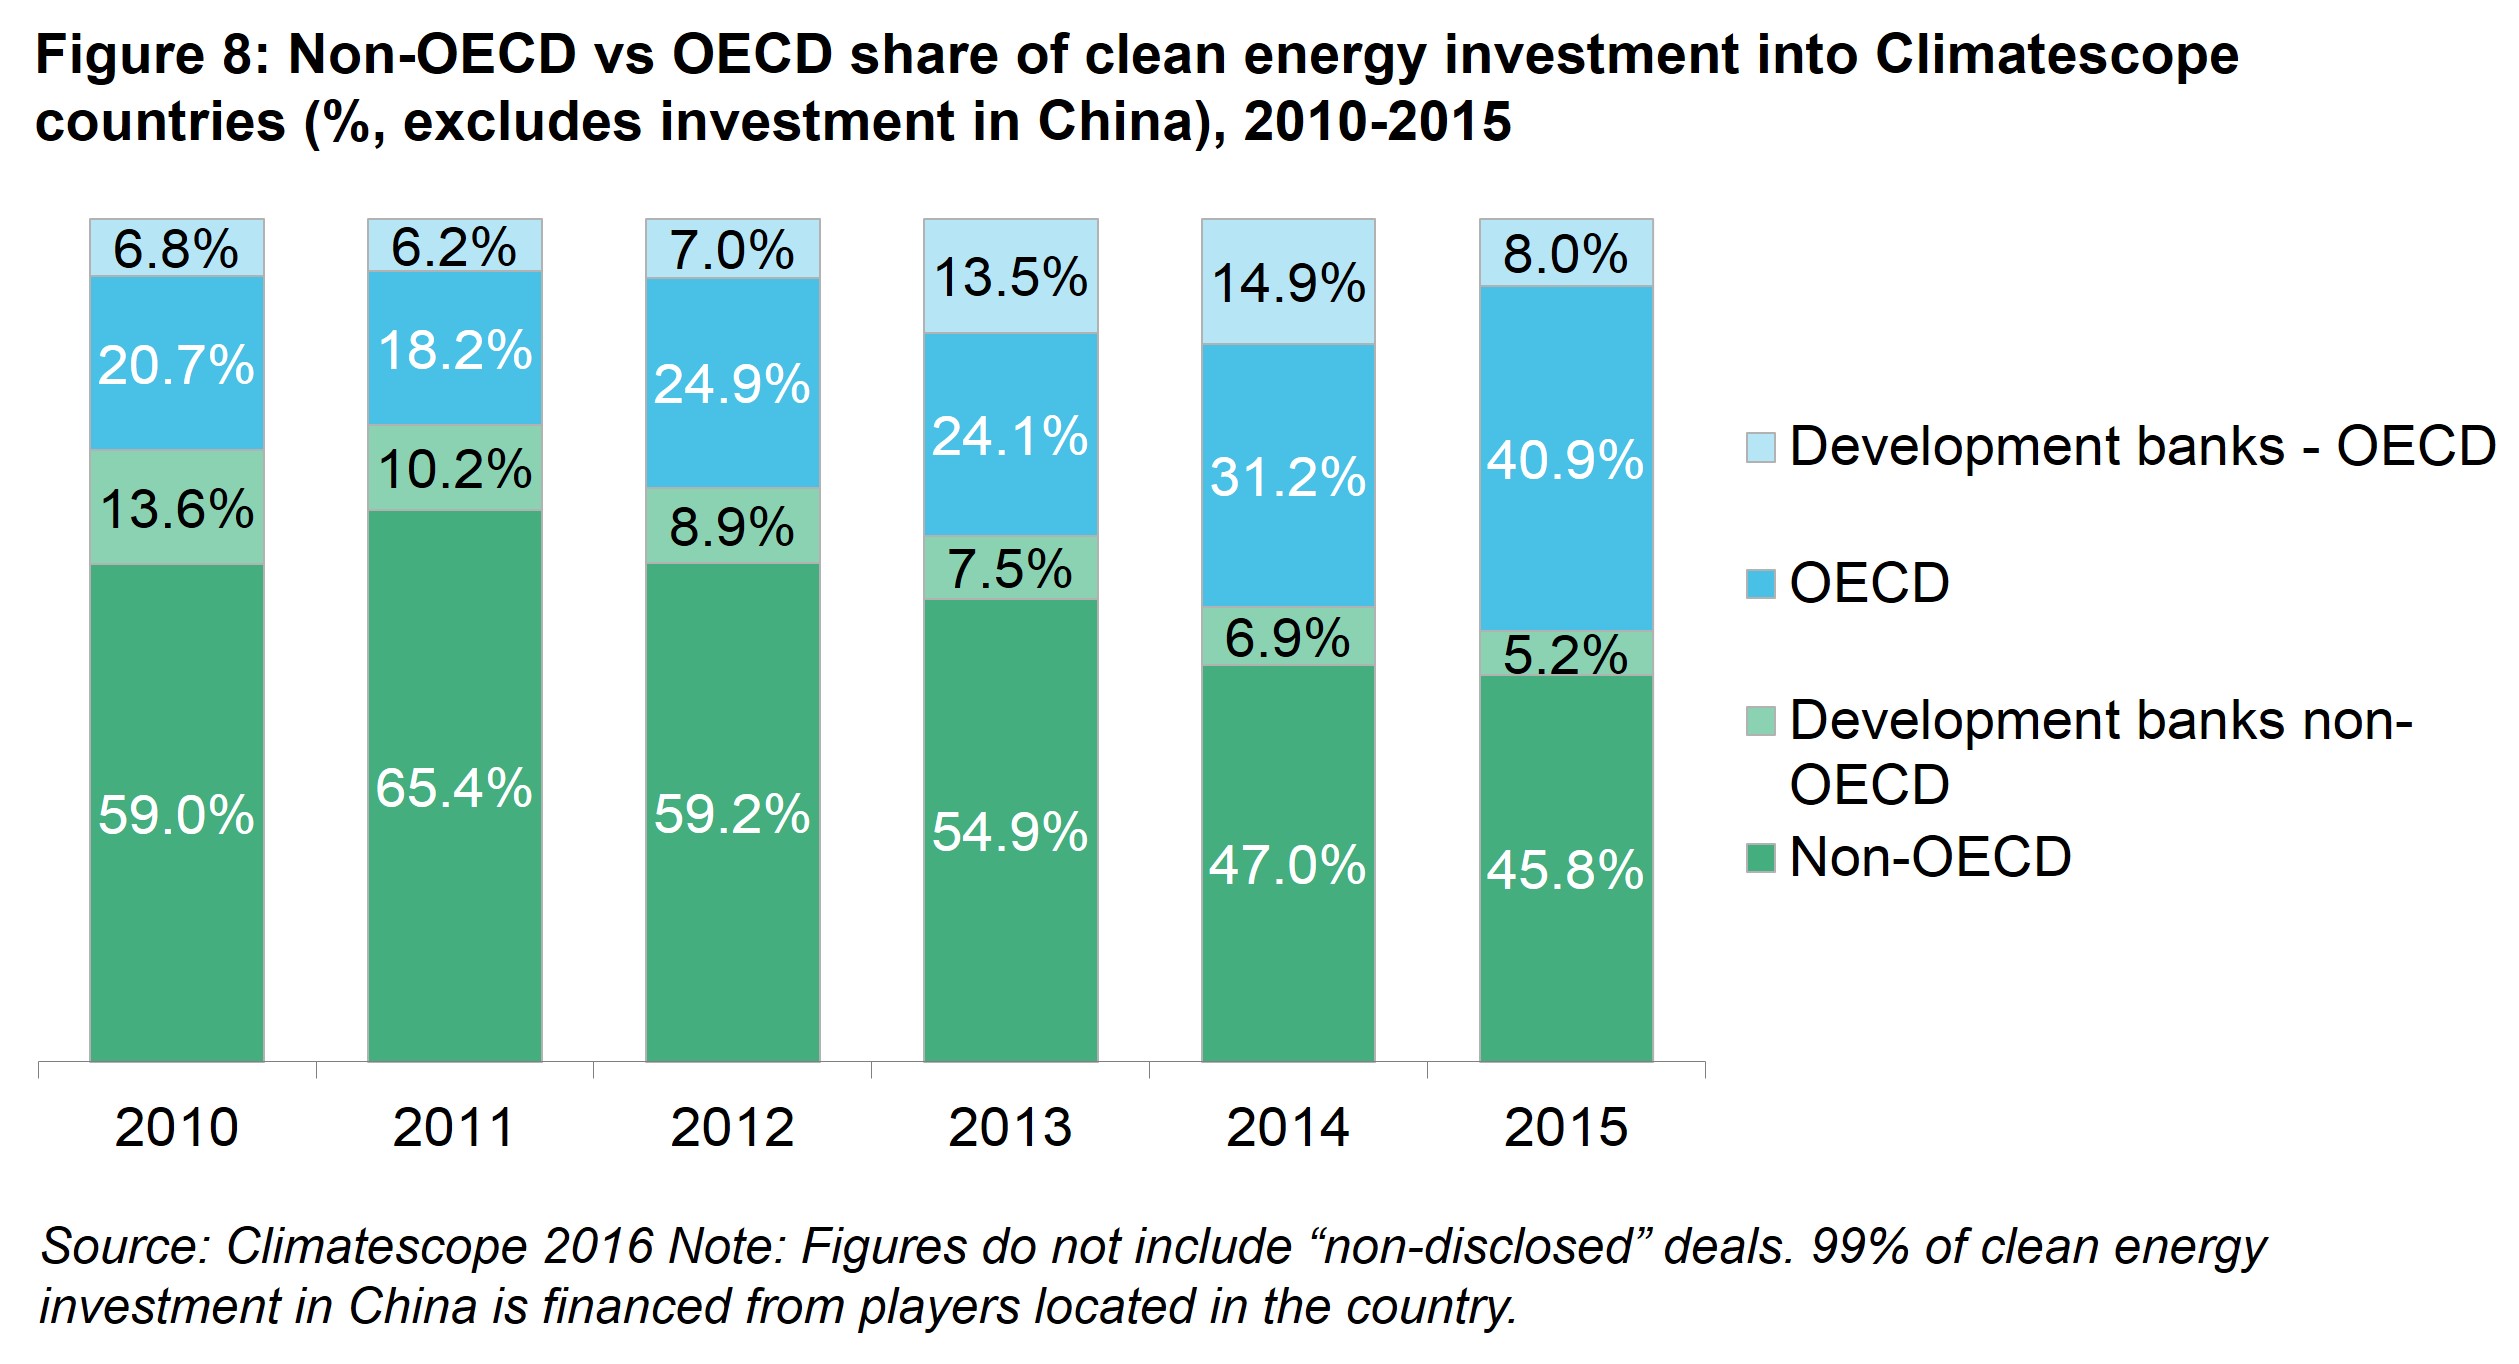
Organizations based in OECD countries were the source of $54.1bn of the fully disclosed private and public clean energy investment flows into Climatescope countries from 2010-2015 and their share of annual disclosed investment has nearly doubled since 2010. The share of capital from development banks located in non-OECD countries on the other hand has slipped. It is clear that domestic development institutions such as Brazil’s Banco Nacional de Desenvolvimento Economico e Social (BNDES) played a crucial role in jump-starting clean energy activity in these countries. Today, they find themselves more often joined by foreign-based players.
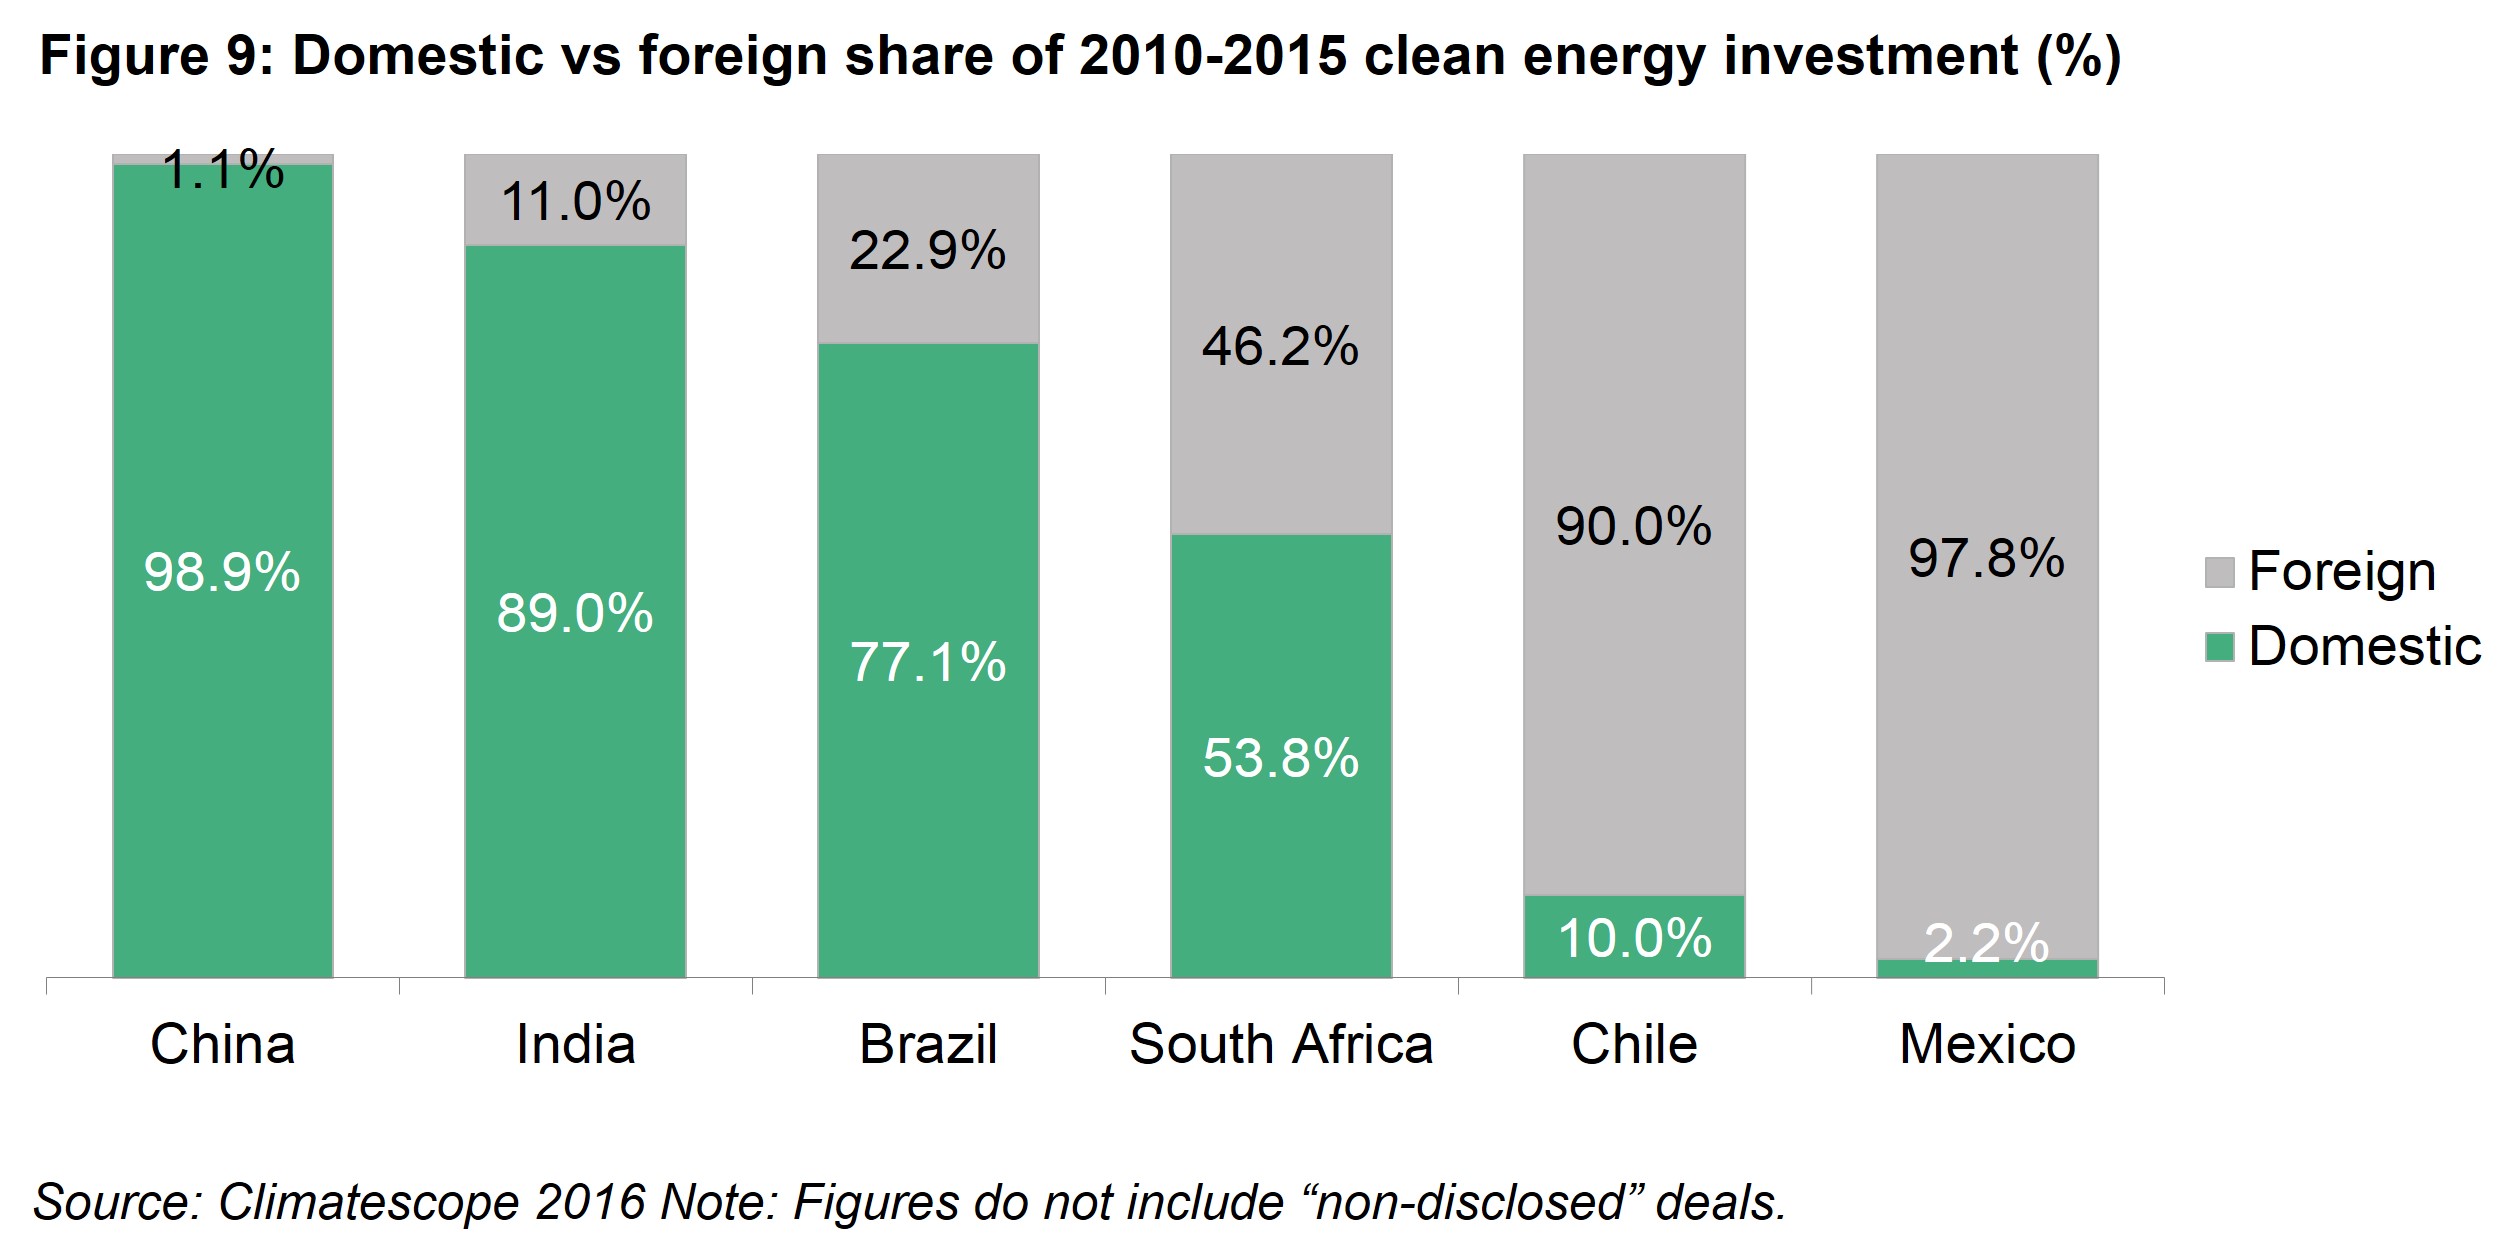
The level of foreign capital involved in supporting clean energy varies widely between Climatescope countries (Figure 9). Almost all such investment in China came from banks and within its borders. At the other end of the spectrum, clean energy in Mexico or Chile has been almost entirely funded externally and has included support from some of the world’s leading energy multinationals. Investment in Brazil and South Africa has come from a heterogeneous group of funders.
As countries’ clean energy markets grow in coming years, further foreign investment will inevitably be required. The government of India has made ambitious pledges to add renewables, for instance, and overseas investors have shown a willingness to deploy capital there.
CLIMATESCOPE COUNTRIES WHICH HAVE SEEN THE HIGHEST RATES OF CLEAN ENERGY PENETRATION ARE NOW BEGINNING TO ENCOUNTER INTEGRATION CHALLENGES
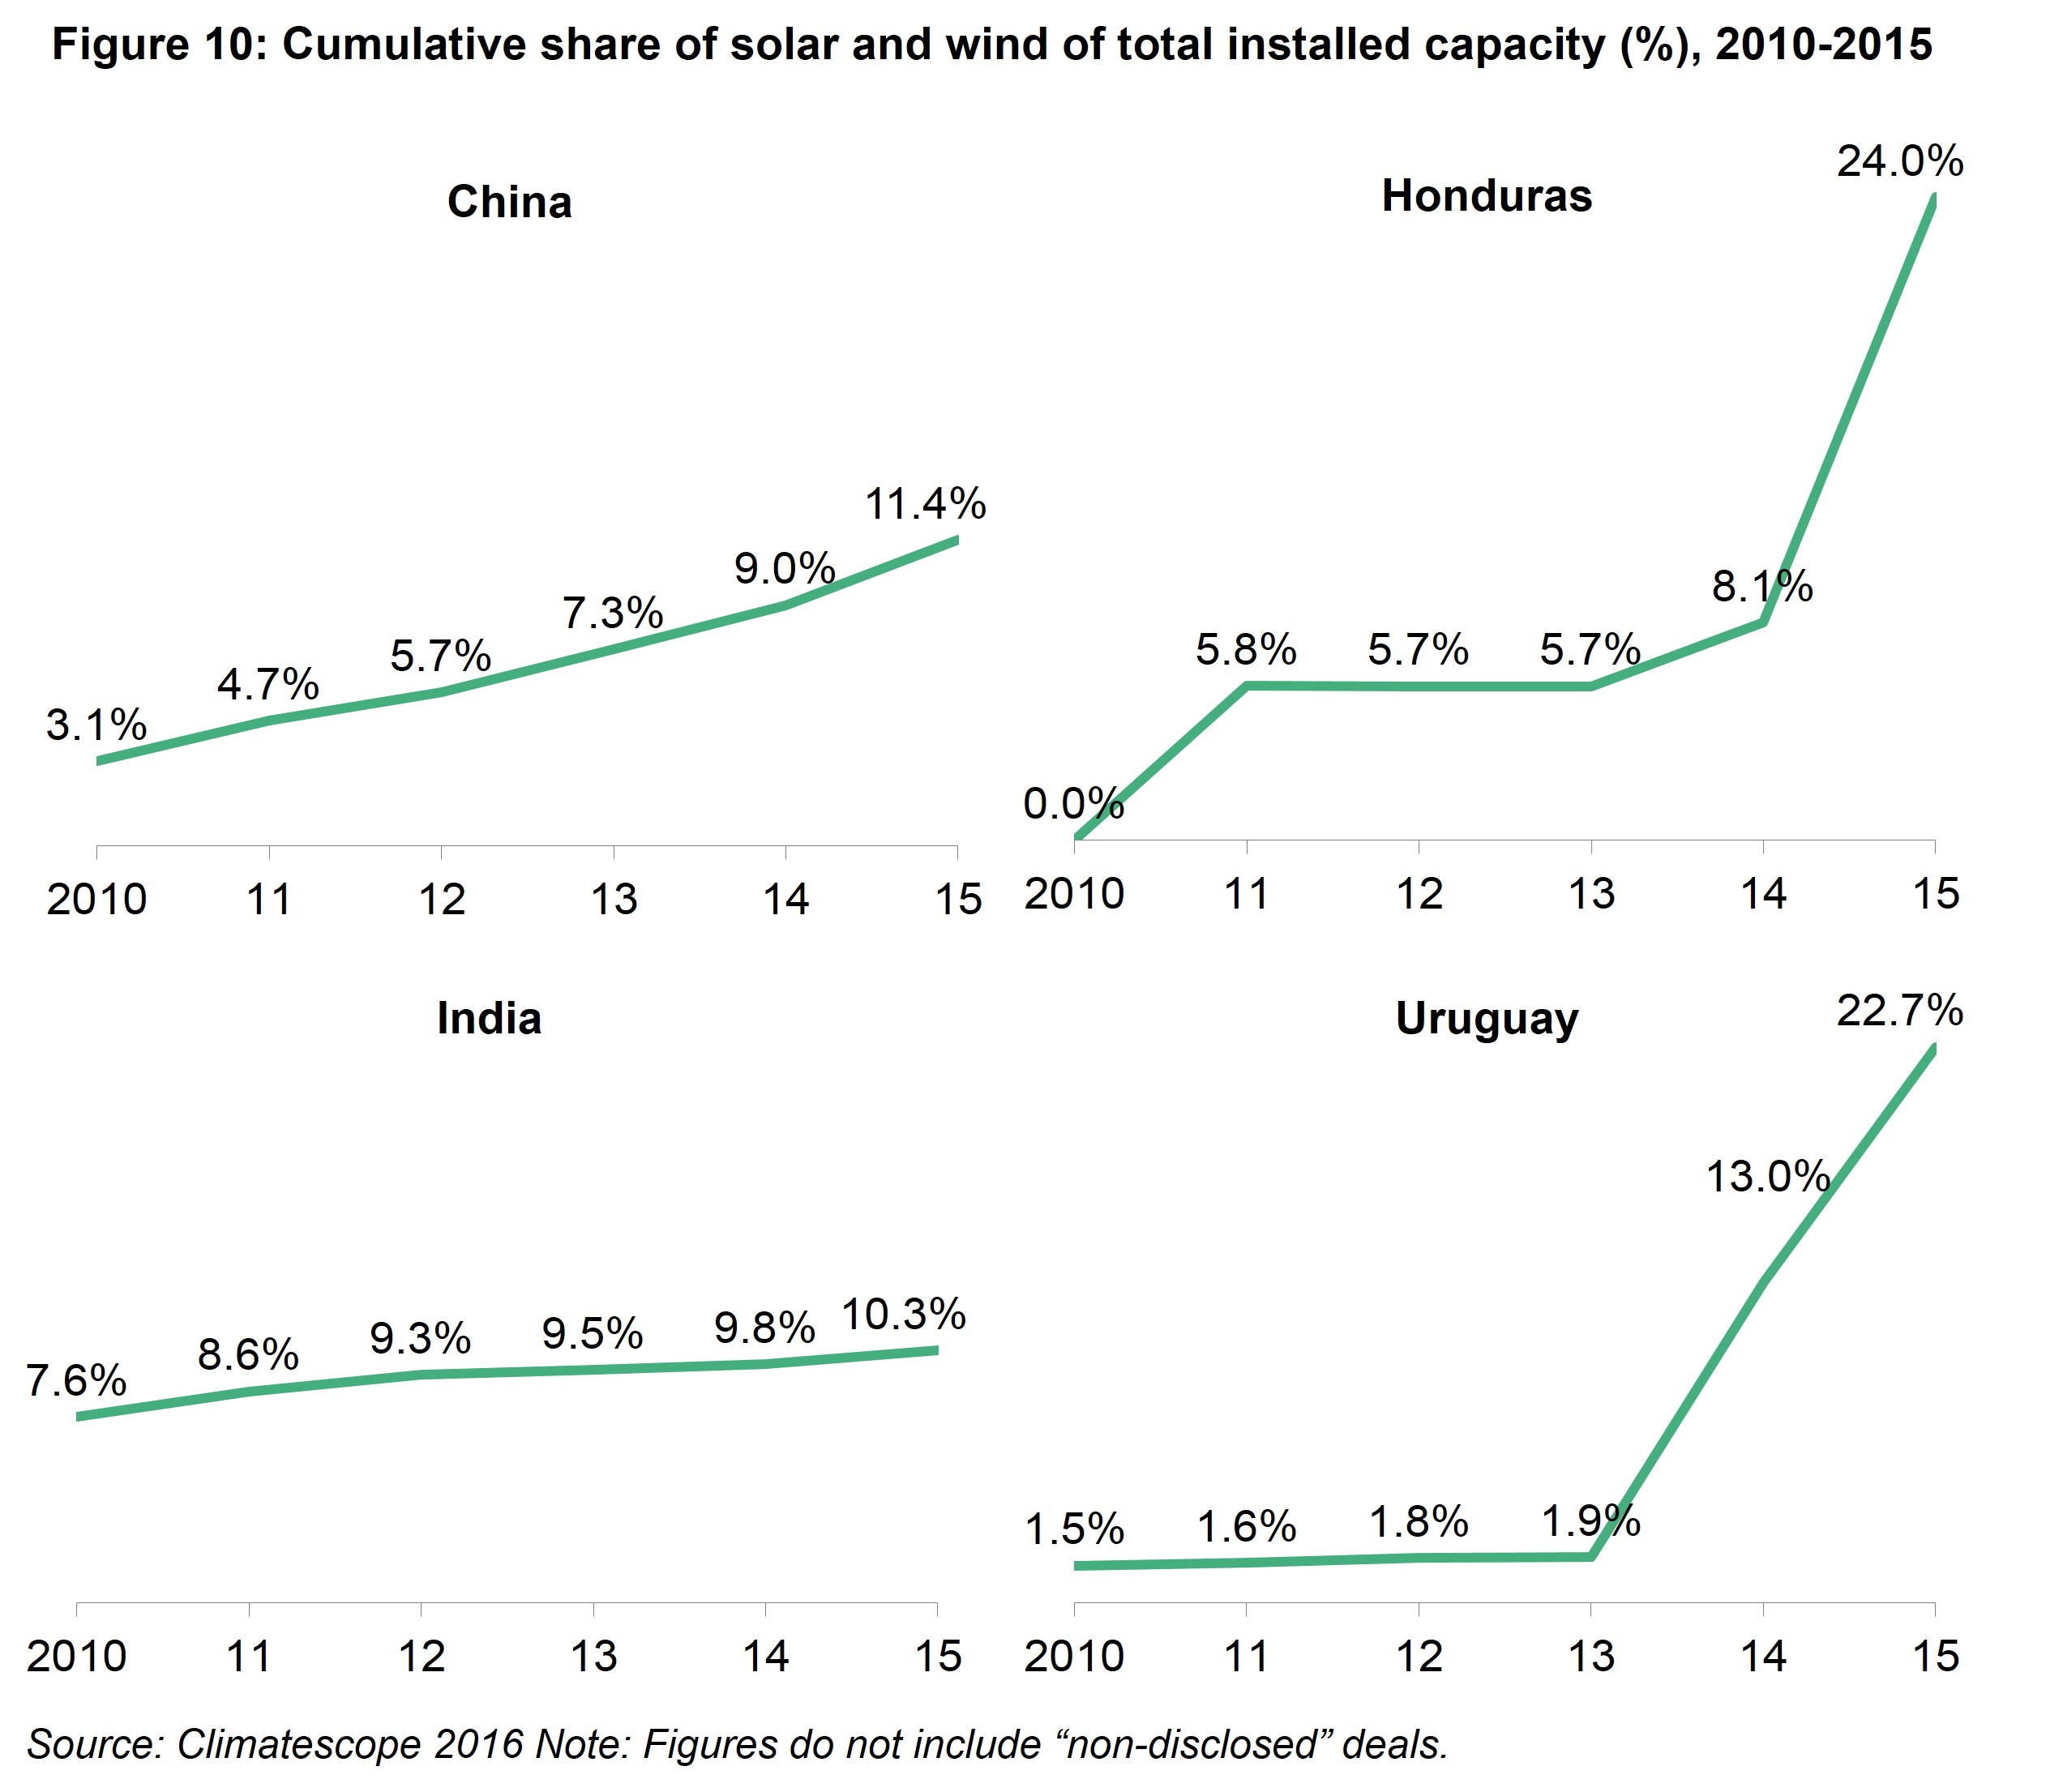
With record levels of investment and deployment inevitably come some growing pains. The surge in investment seen over the past five years has resulted in unprecedented levels of clean energy penetration, particularly in some smaller Climatescope nations (Figure 10). The sheer pace of the build-out, the shaky nature of a number of grids in these countries, and the intermittency of generation from renewables has contributed to technical and financial challenges.
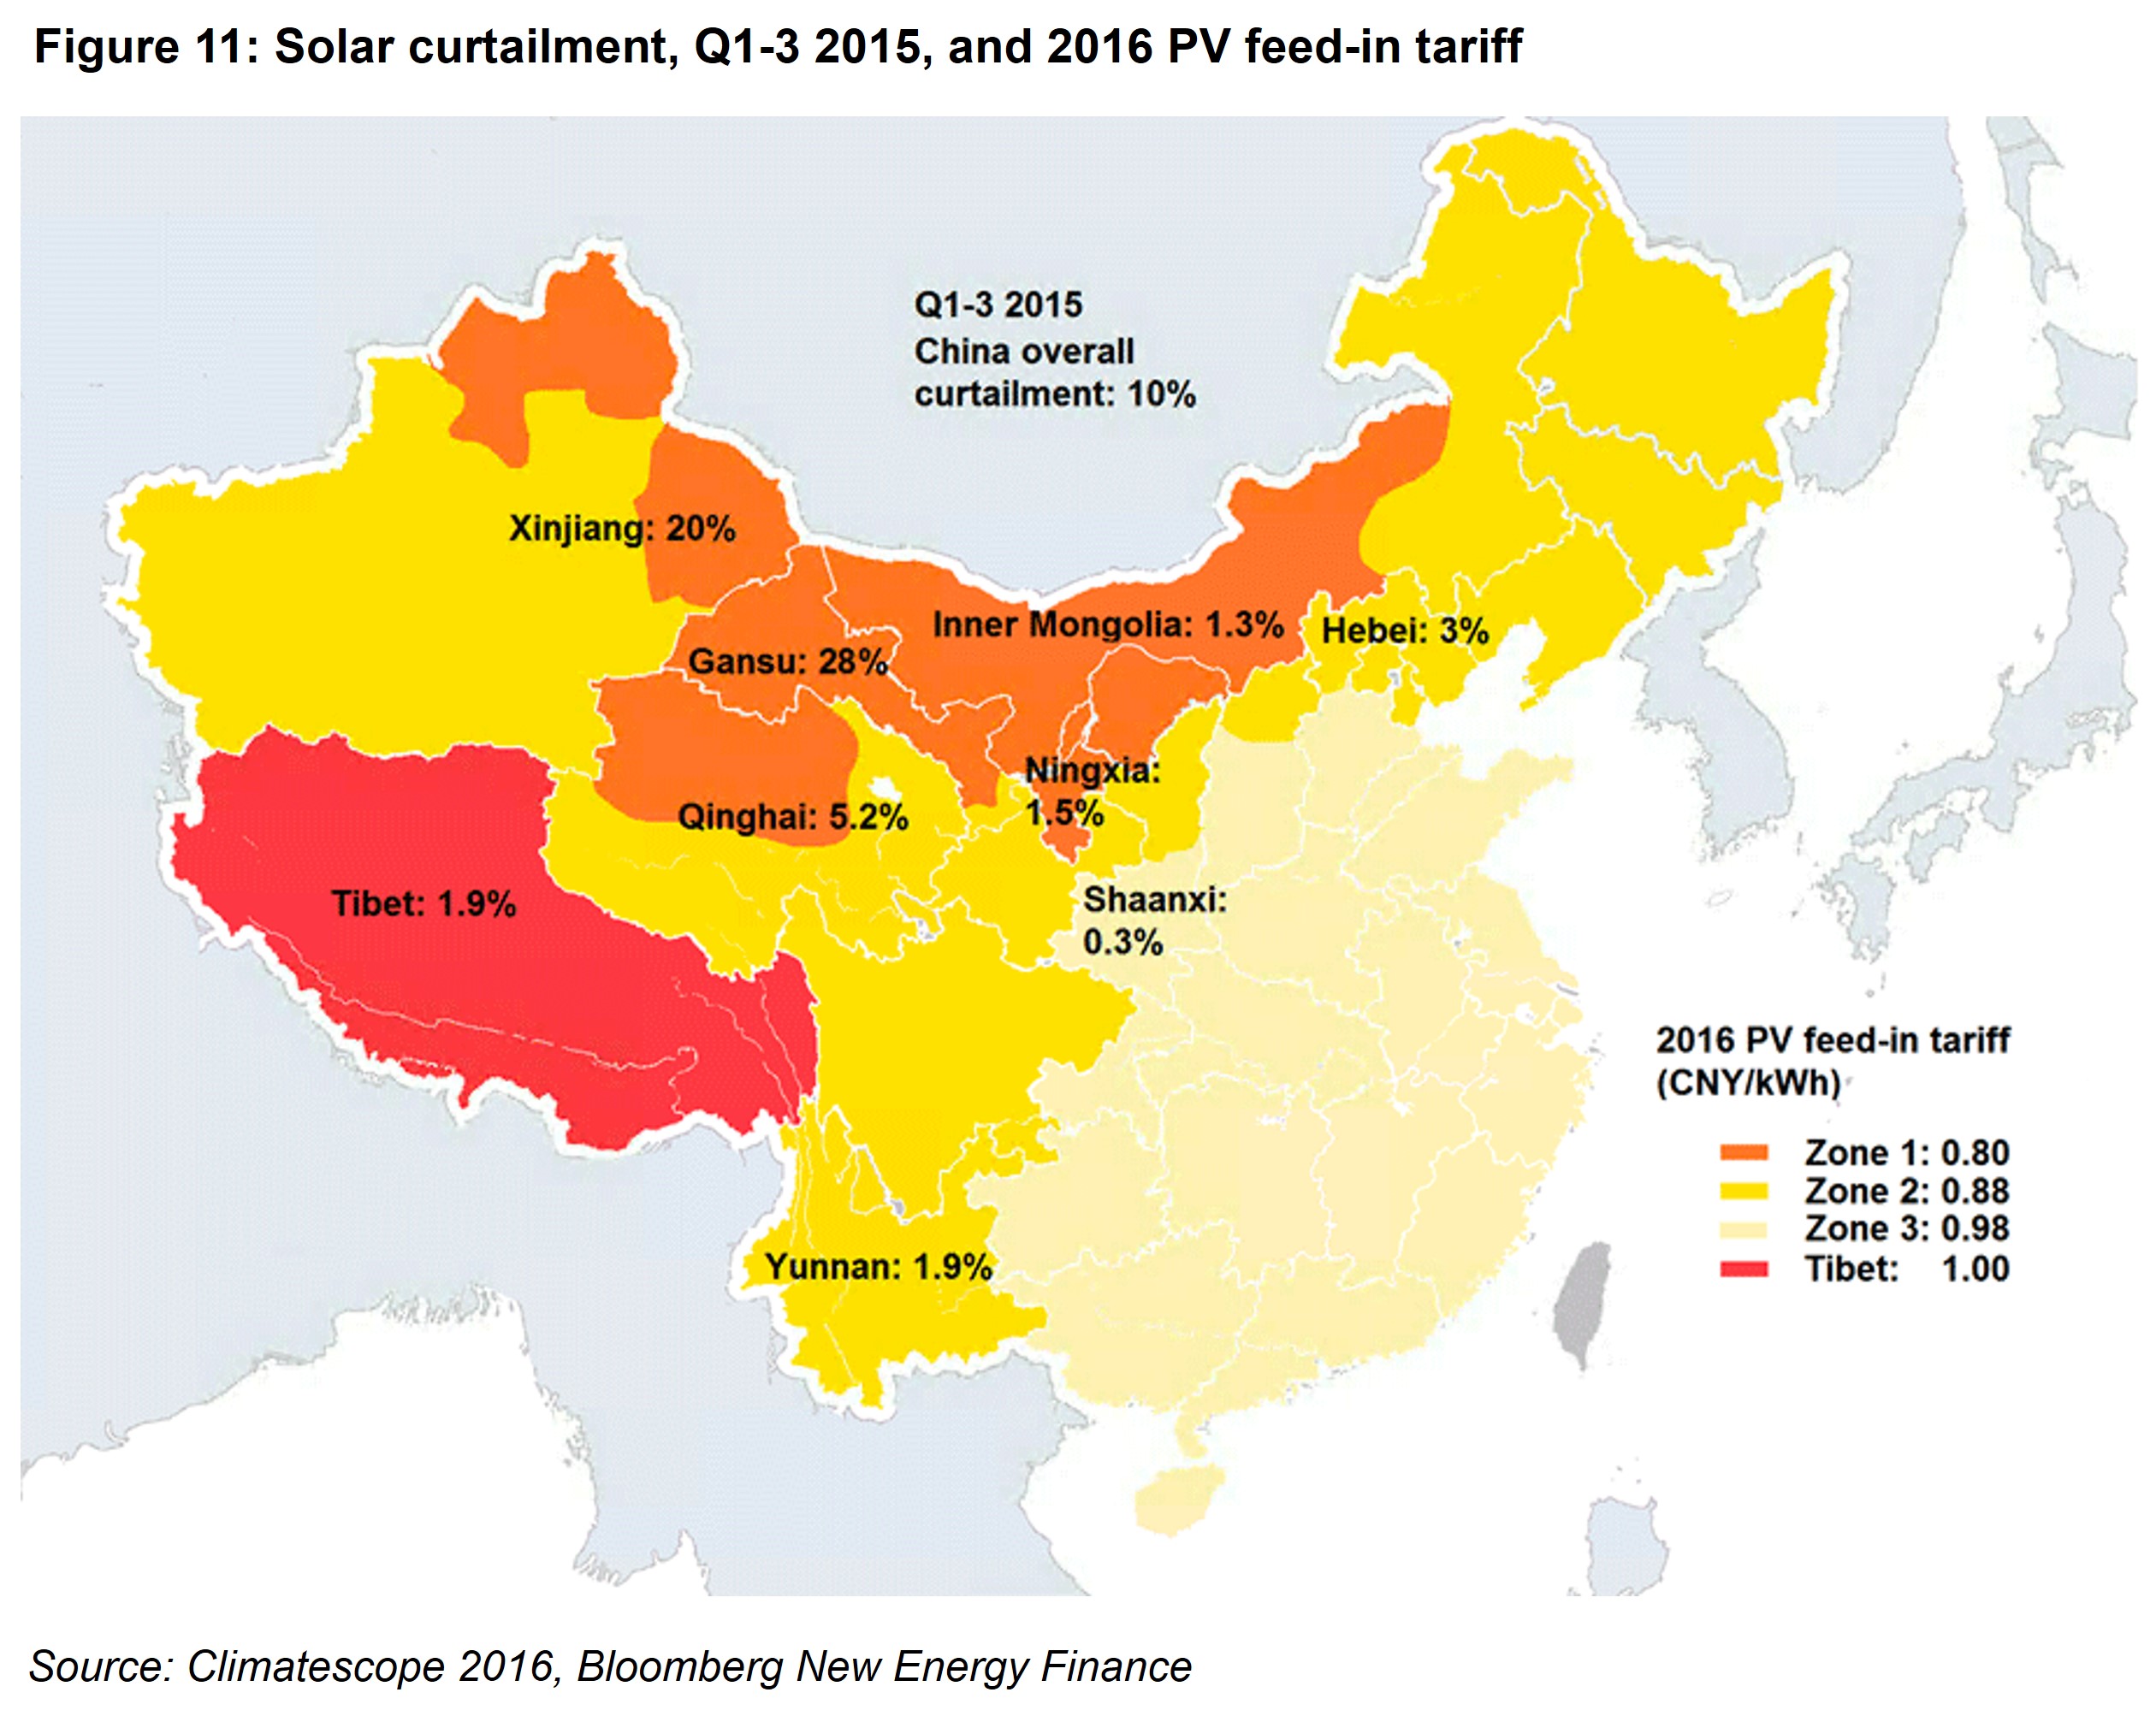
Renewable project owners in Brazil, China, India and South Africa have had to cope with issues ranging from relatively minor connection delays, to high levels of curtailment (Figure 11) and payment arrears of more than a year. Such infrastructure-related challenges are hardly unique to emerging markets. In Germany, for instance, construction of vital north-south transmission lines intended to better accommodate renewables is expected to take well over a decade to complete.
Some of the smaller Climatescope nations have seen the highest levels of clean energy penetration. Honduras and Uruguay, for instance, have 24% and 22.7% of their capacity accounted for by renewables. By comparison, in the much larger economies of China and India, renewables account for 11.4% and 10.3% respectively. Nevertheless these challenges can arise at both ends of the spectrum if inadequate grid infrastructure exists.
By its very nature, clean energy can pose difficulties for grid operators and liberalized power markets. As wind, solar, and other technologies account for greater market share, better planning will surely be needed to accommodate them.
THESE IMPROVING CONDITIONS ARE REFLECTED IN HIGHER CLIMATESCOPE SCORES ACHIEVED BY THE MAJORITY OF COUNTRIES SURVEYED
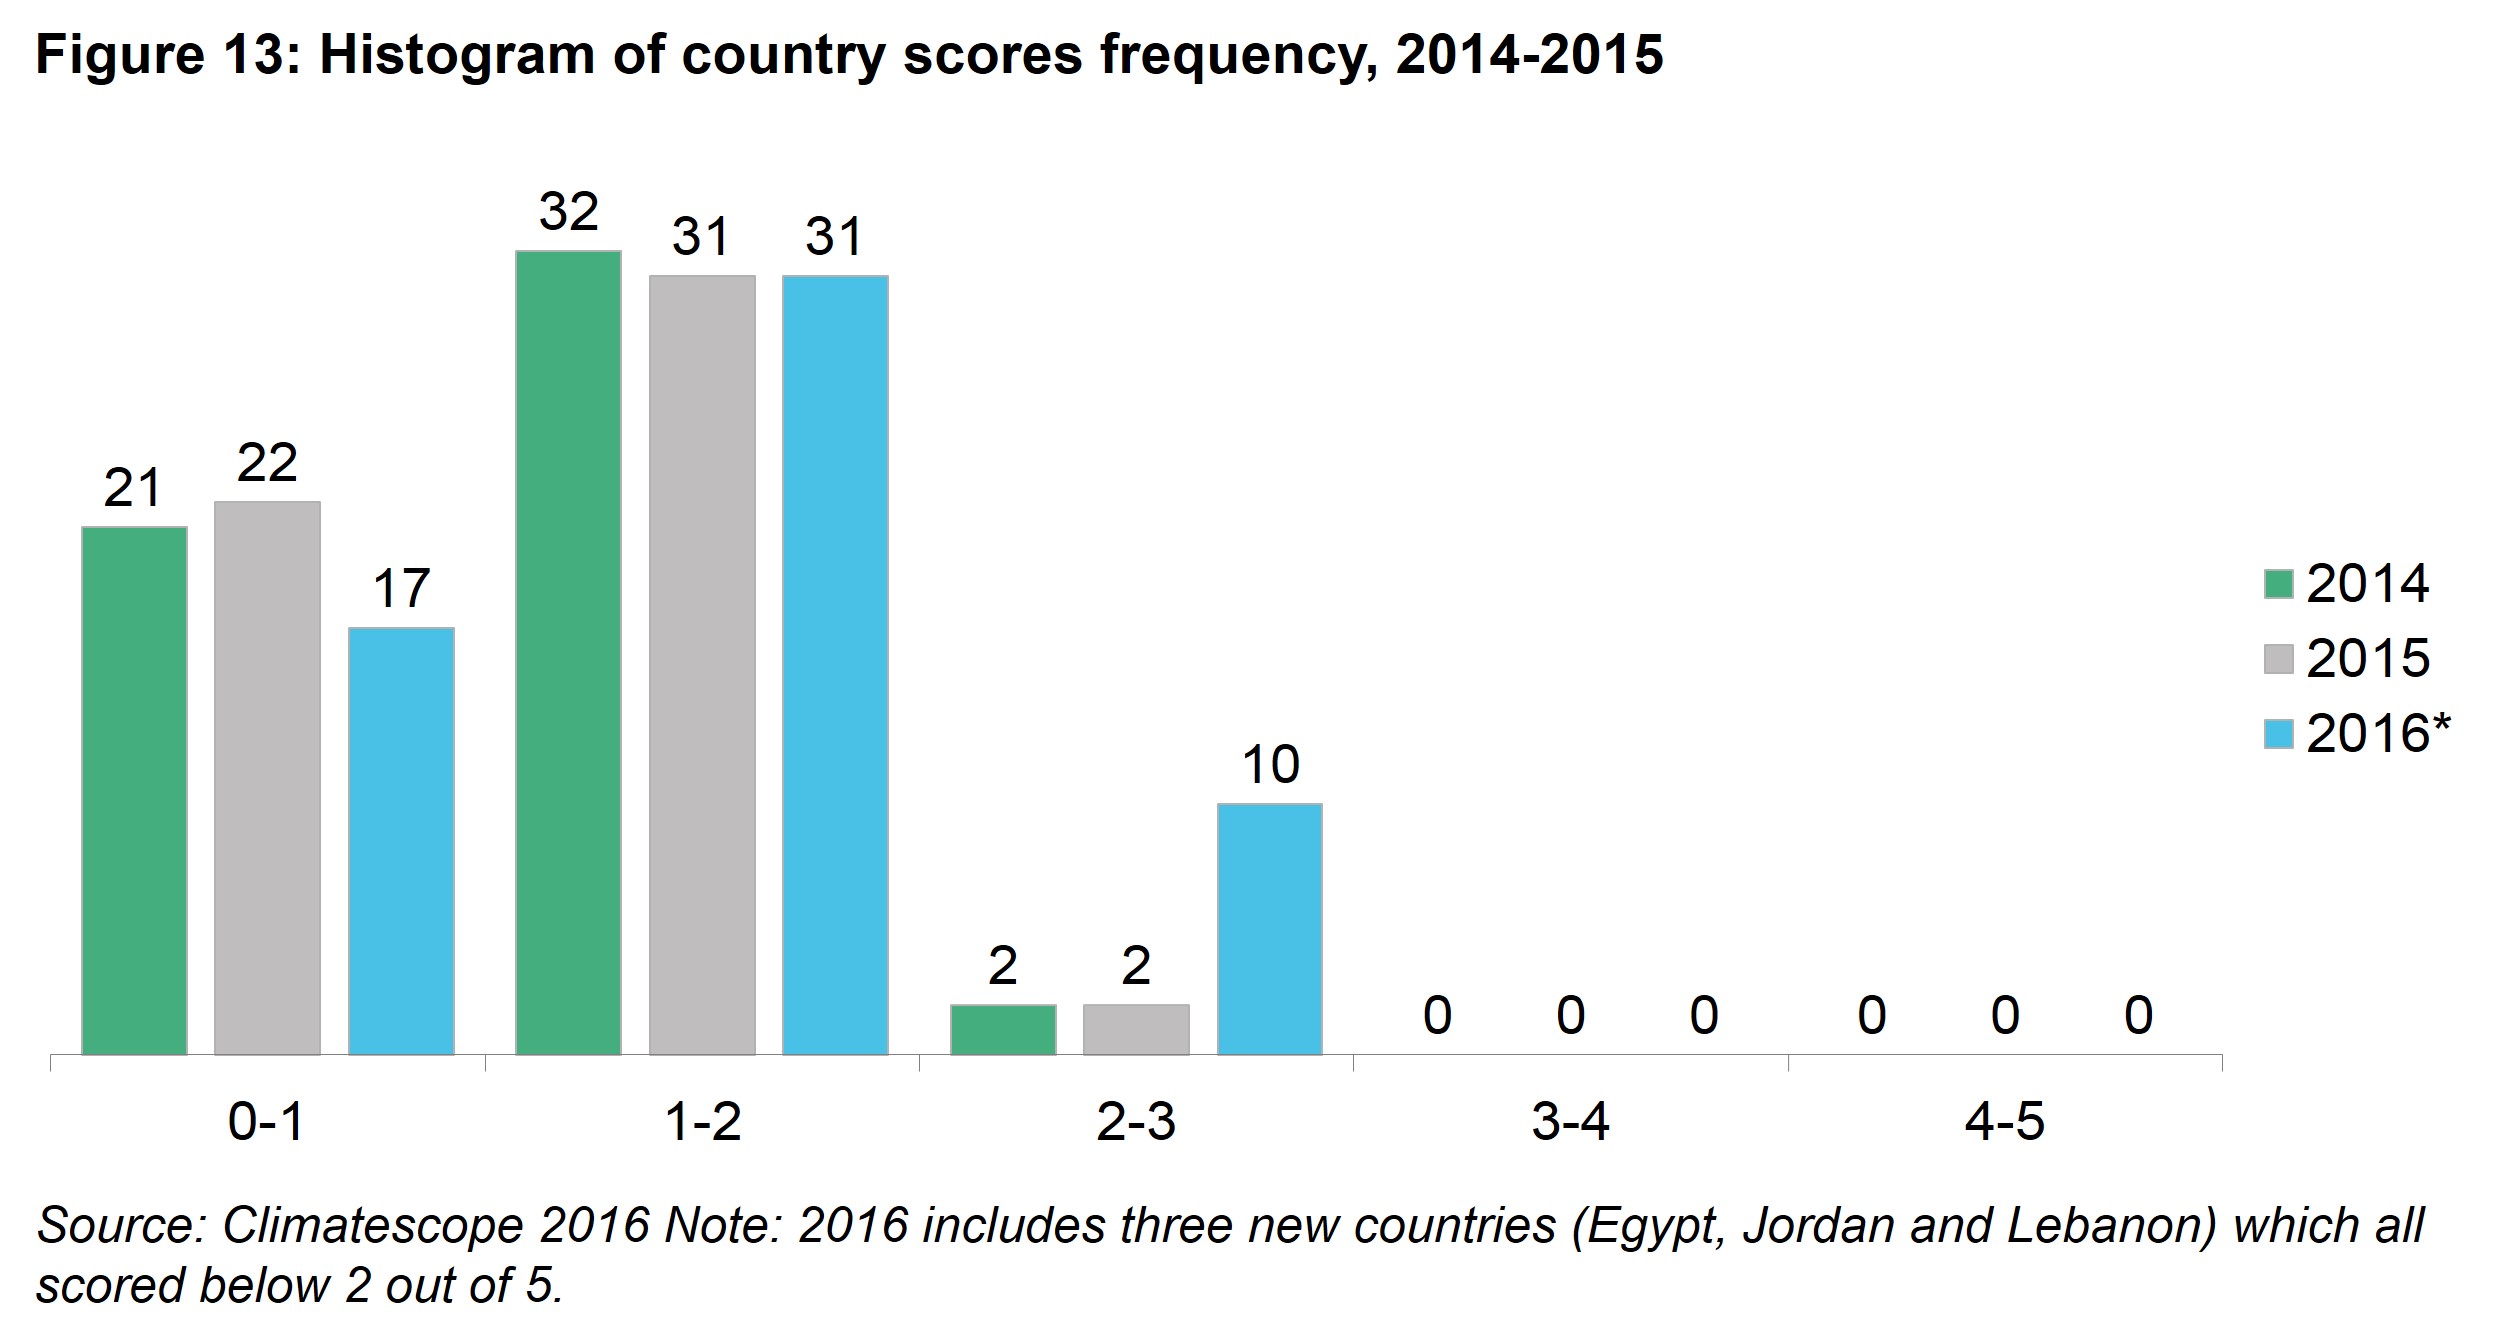
This year’s Climatescope marks a notable improvement in investment environment for clean energy in the developing markets reviewed (Figure 12). The average Climatescope score for the countries survey bumped up from 1.14 to 1.35. The number of countries scoring above 2 out of a maximum of 5 has jumped from just two in the 2014 and 2015 Climatescopes, to 10 this year (Figure 13).
This performance was largely driven by markedly higher scores on the first parameter, which reflects the enabling framework for clean energy investment in the country, and the fourth parameter which focuses on greenhouse gas management activities. The fact that four in five Climatescope countries now have emissions reduction targets and four in five have renewable energy targets has pushed up the scores across these two parameters.
Honduras (up 0.86 between 2014 and 2016), Chile (+0.57), Uruguay (+0.53), Mexico (+0.28) and Kenya (+0.32) have all scored over 2 out of 5 and are among the countries that recorded the most progress since the first edition of Global Climatescope in 2014. Four of the eight new countries to exceed the score of 2 are located in Latin America and the Caribbean. This was generally due to improving enabling frameworks for clean energy in the region and specifically due to greater use of feed-in tariffs and auctions policies.
1 International Energy Agency, World Energy Investment Report, 2016.